T-Mobile Investor Day Presentation Deck
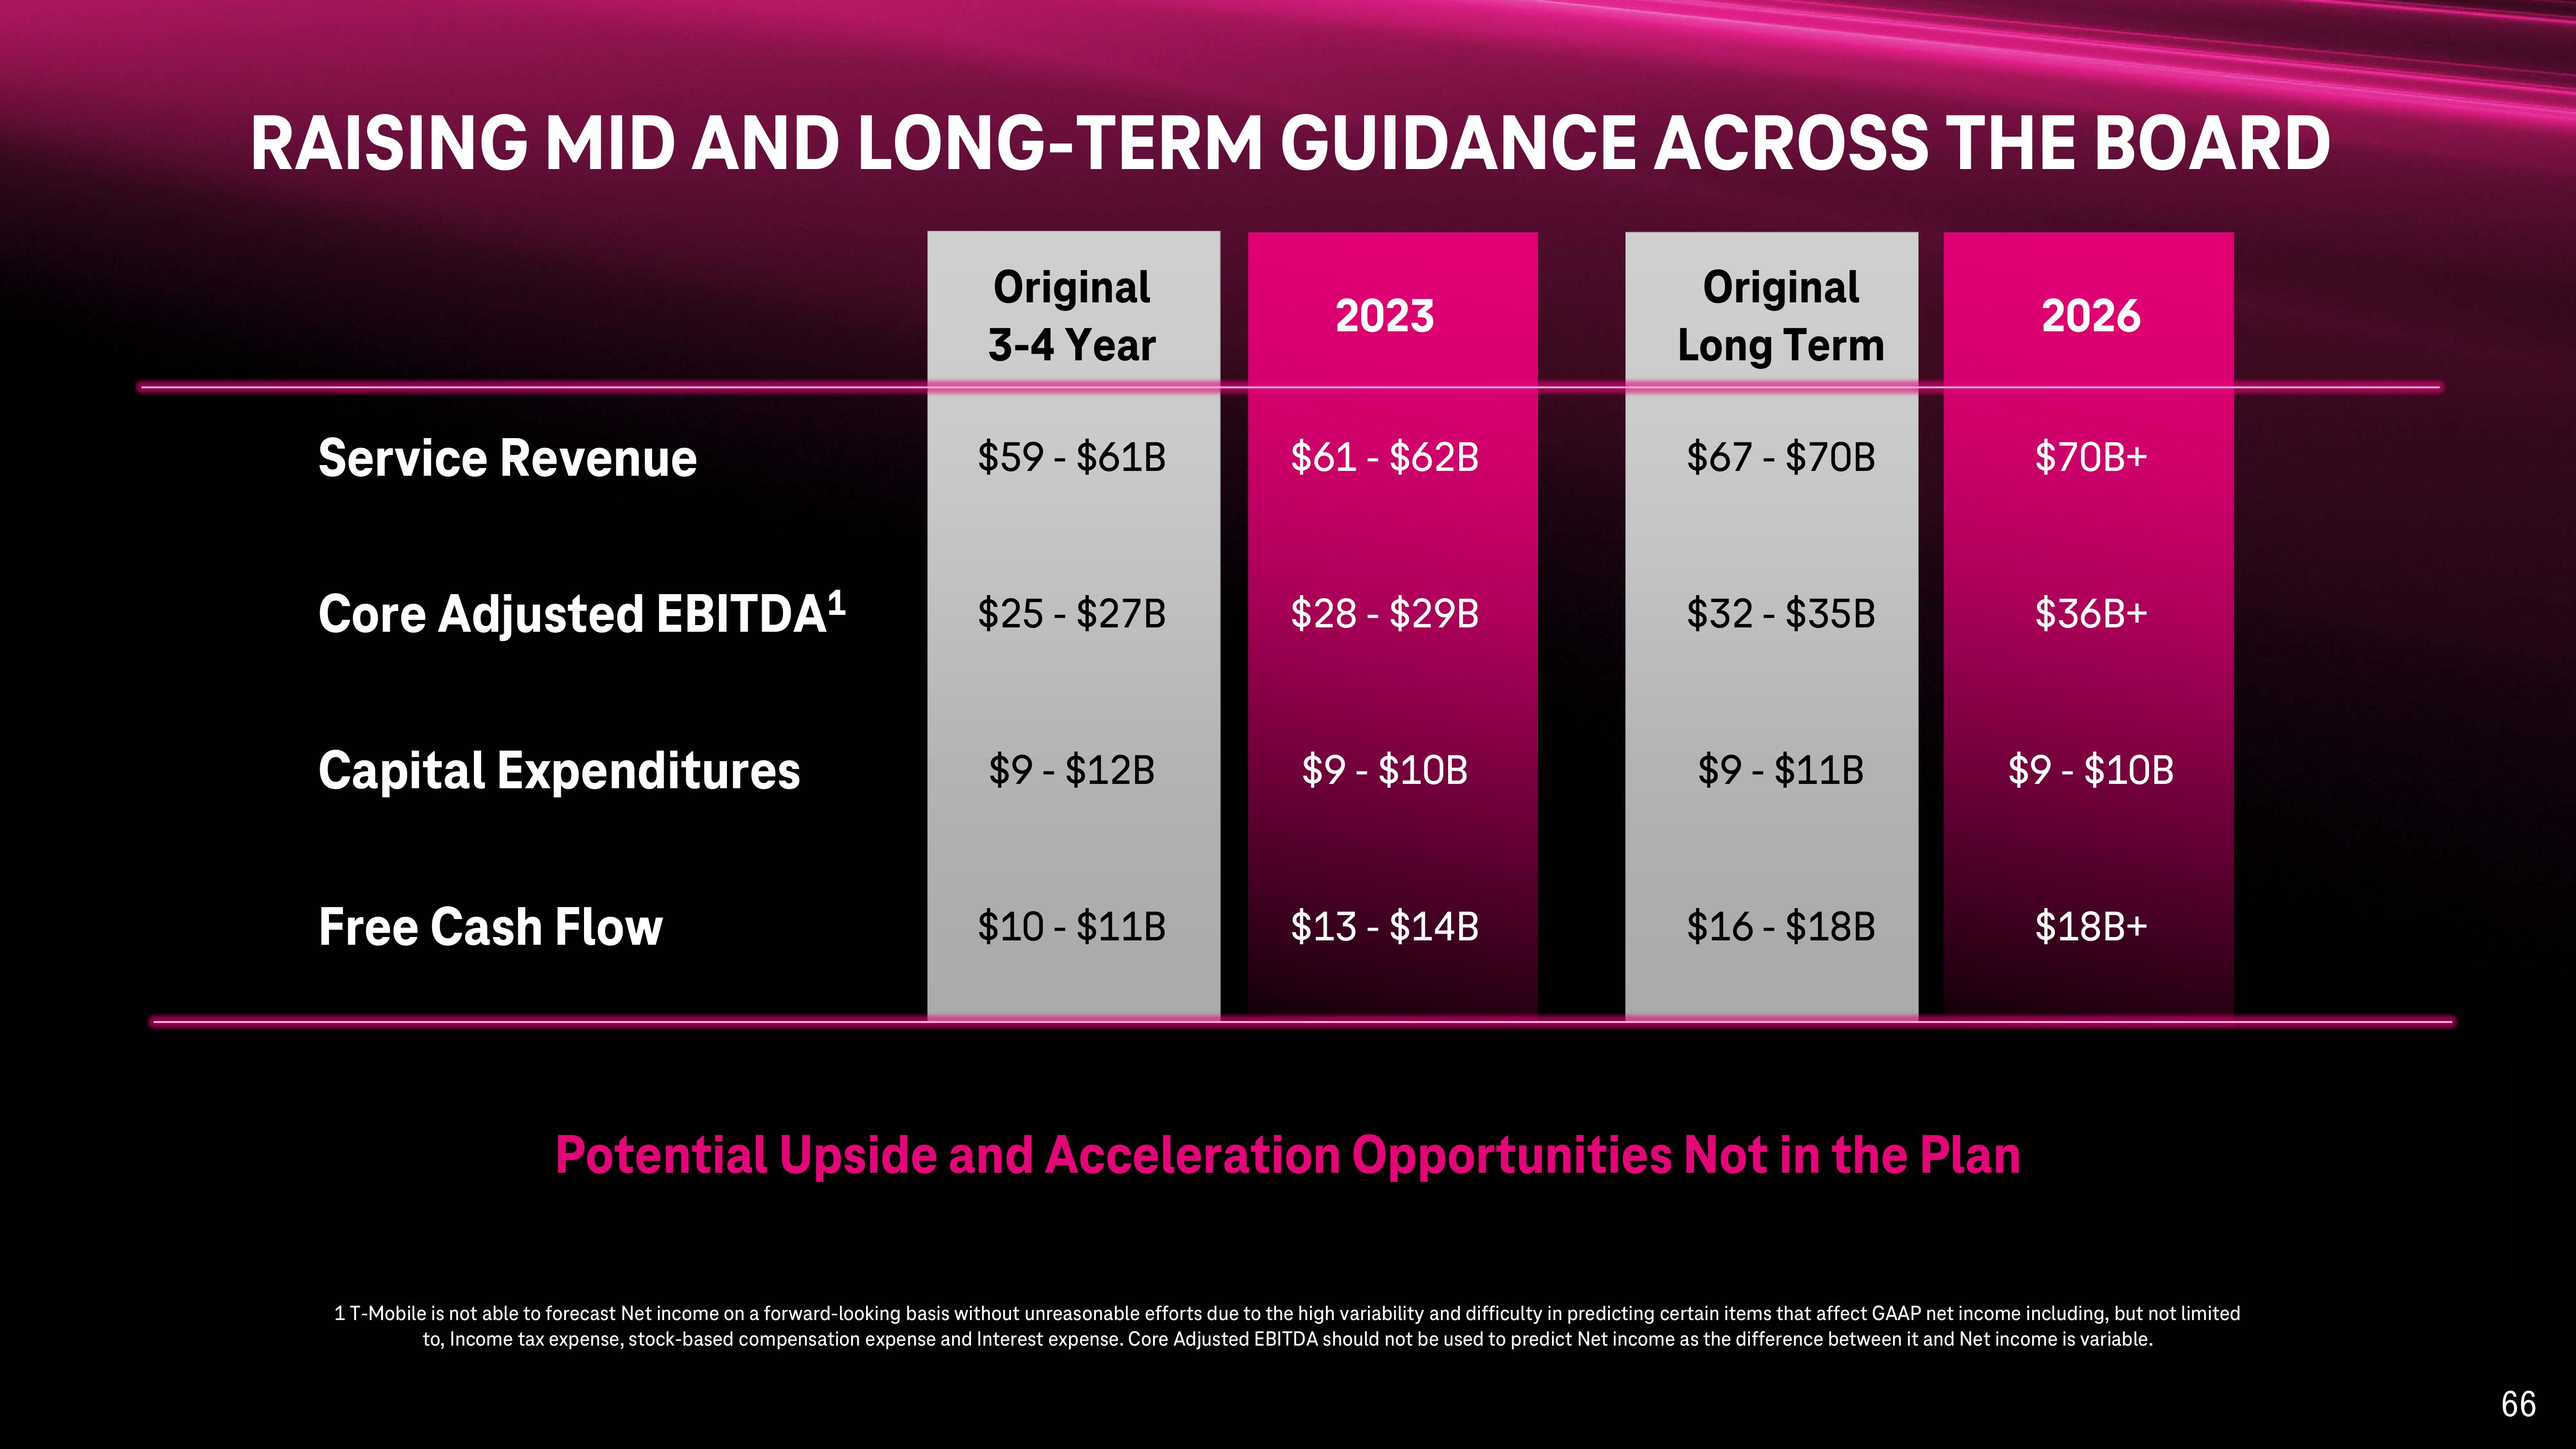
RAISING MID AND LONG-TERM GUIDANCE ACROSS THE BOARD
Original
3-4 Year
Original
Long Term
Service Revenue
Core Adjusted EBITDA¹
Capital Expenditures
Free Cash Flow
$59- $61B
$25 - $27B
$9 - $12B
$10-$11B
2023
$61 - $62B
$28-$29B
$9 - $10B
$13-$14B
$67 - $70B
$32- $35B
$9 - $11B
$16-$18B
2026
Potential Upside and Acceleration Opportunities Not in the Plan
$70B+
$36B+
$9 - $10B
$18B+
1 T-Mobile is not able to forecast Net income on a forward-looking basis without unreasonable efforts due to the high variability and difficulty in predicting certain items that affect GAAP net income including, but not limited
to, Income tax expense, stock-based compensation expense and Interest expense. Core Adjusted EBITDA should not be used to predict Net income as the difference between it and Net income is variable.
66View entire presentation