Docebo Investor Presentation Deck
METRIC
Revenue
Subscription Revenue Growth (YoY)
Recurring Subscription Revenue Mix
(% of Total Revenue)
Gross Profit Margin
Adjusted EBITDA Margin²
Adjusted EPS (Diluted)²
Free Cash Flow Margin²
(1)
(2)
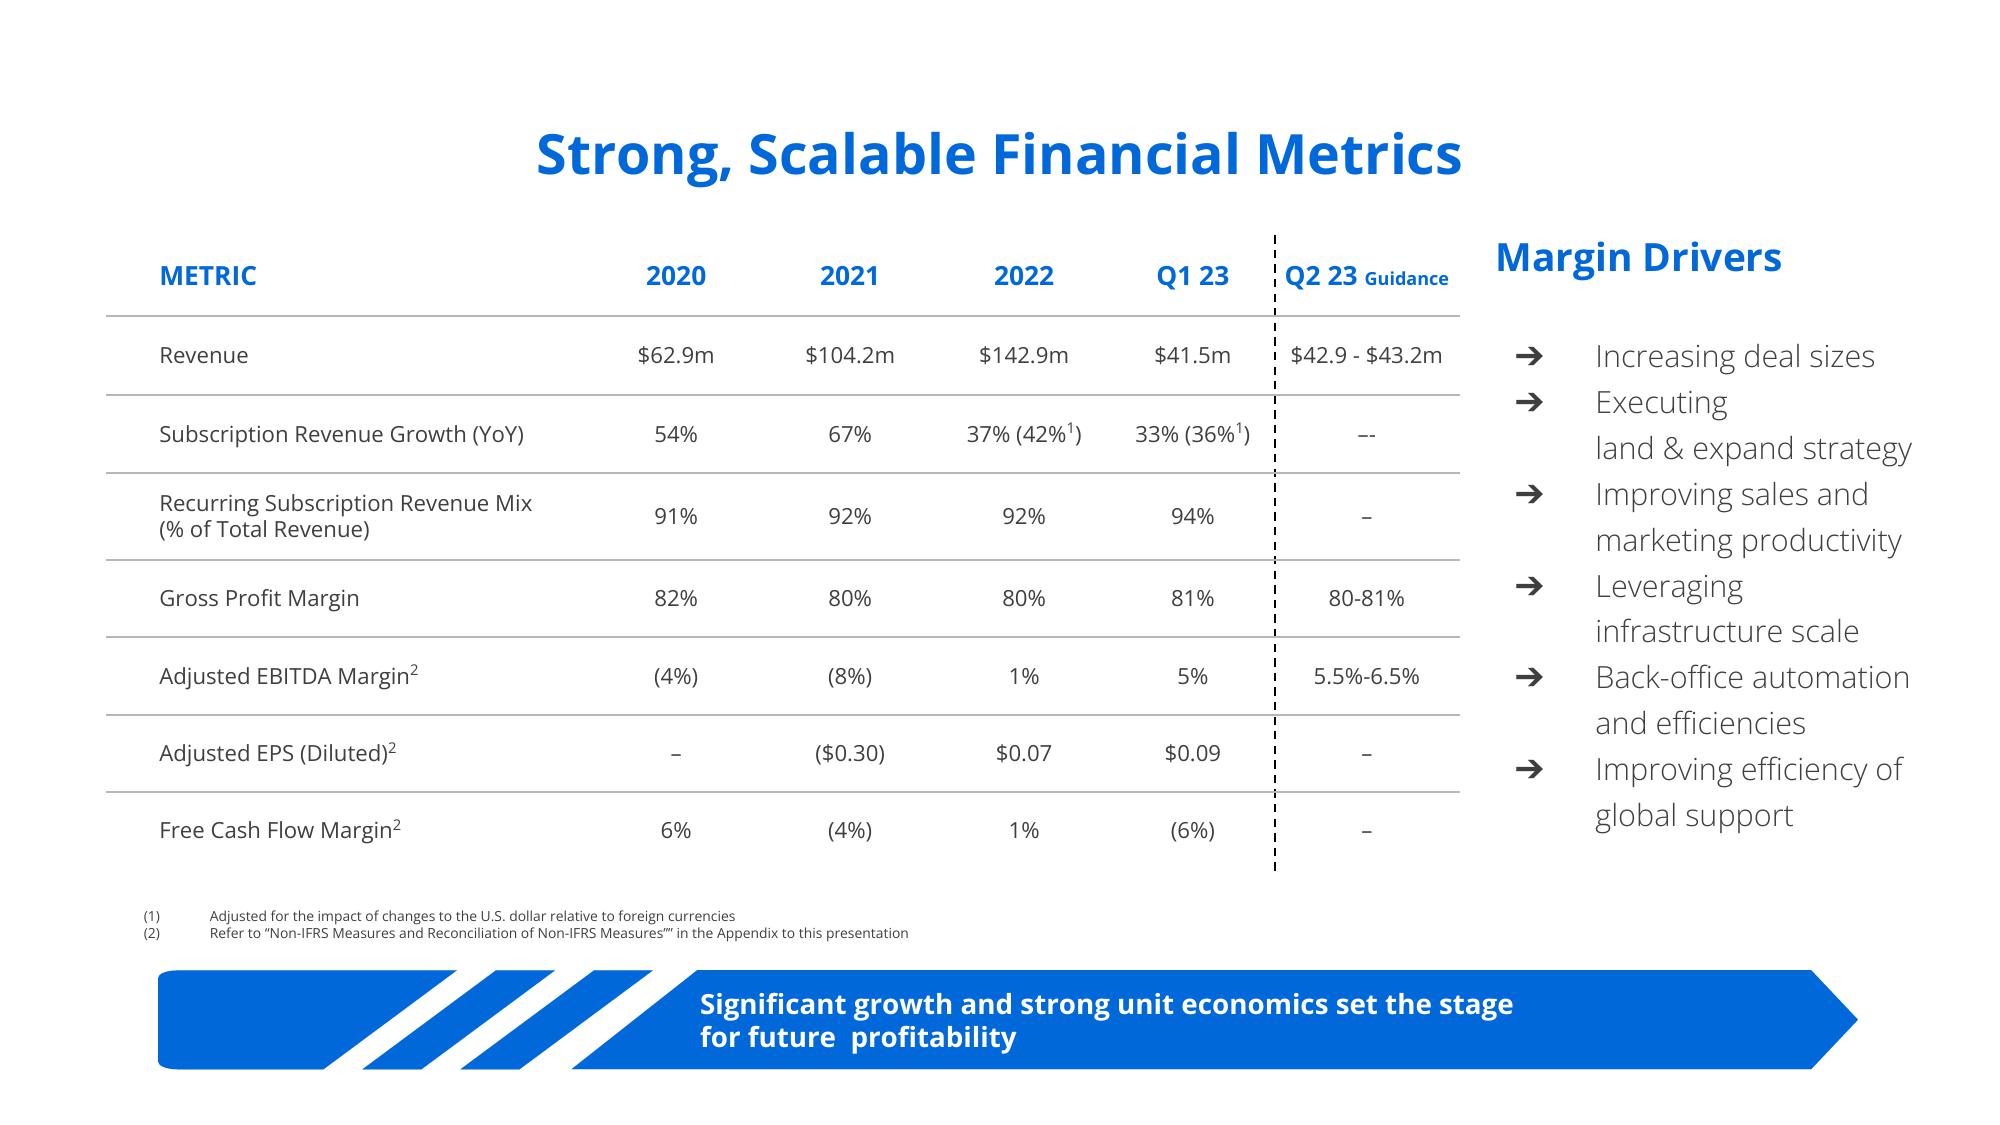
Strong, Scalable Financial Metrics
2020
$62.9m
54%
91%
82%
(4%)
6%
2021
$104.2m
67%
92%
80%
(8%)
($0.30)
(4%)
Adjusted for the impact of changes to the U.S. dollar relative to foreign currencies
Refer to "Non-IFRS Measures and Reconciliation of Non-IFRS Measures in the Appendix to this presentation
M
2022
$142.9m
37% (42%¹)
92%
80%
1%
$0.07
1%
Q1 23
33% (36%¹)
94%
$41.5m i $42.9 $43.2m
81%
5%
$0.09
I
(6%)
I
I
Q2 23 Guidance
I
80-81%
5.5%-6.5%
Margin Drivers
Significant growth and strong unit economics set the stage
for future profitability
↑
→
Increasing deal sizes
Executing
land & expand strategy
Improving sales and
marketing productivity
Leveraging
infrastructure scale
Back-office automation
and efficiencies
Improving efficiency of
global supportView entire presentation