Hypebeast Results Presentation Deck
୮
HK$
Hypebeast Ltd. 150.HK
Financial Snapshot
1,000M
750M
500M
250M
HYPEBEAST
OM
Total Revenue
53%
385M
FY18
50%
+ Gross Profit Margin
672M
FY19
51%
751M
FY20
50%
674M
FY21
61%
896M
FY22
70%
60%
50%
40%
30%
HK$'000
Revenues
Gross Profit
Gross Profit Margin
S&M Expense
(as % of Revenues)
A&O Expense
(as % of Revenues)
EBITDA¹
EBITDA Margin
One-Off Merger Expense²
Adjusted EBITDA³
Adjusted EBITDA Margin
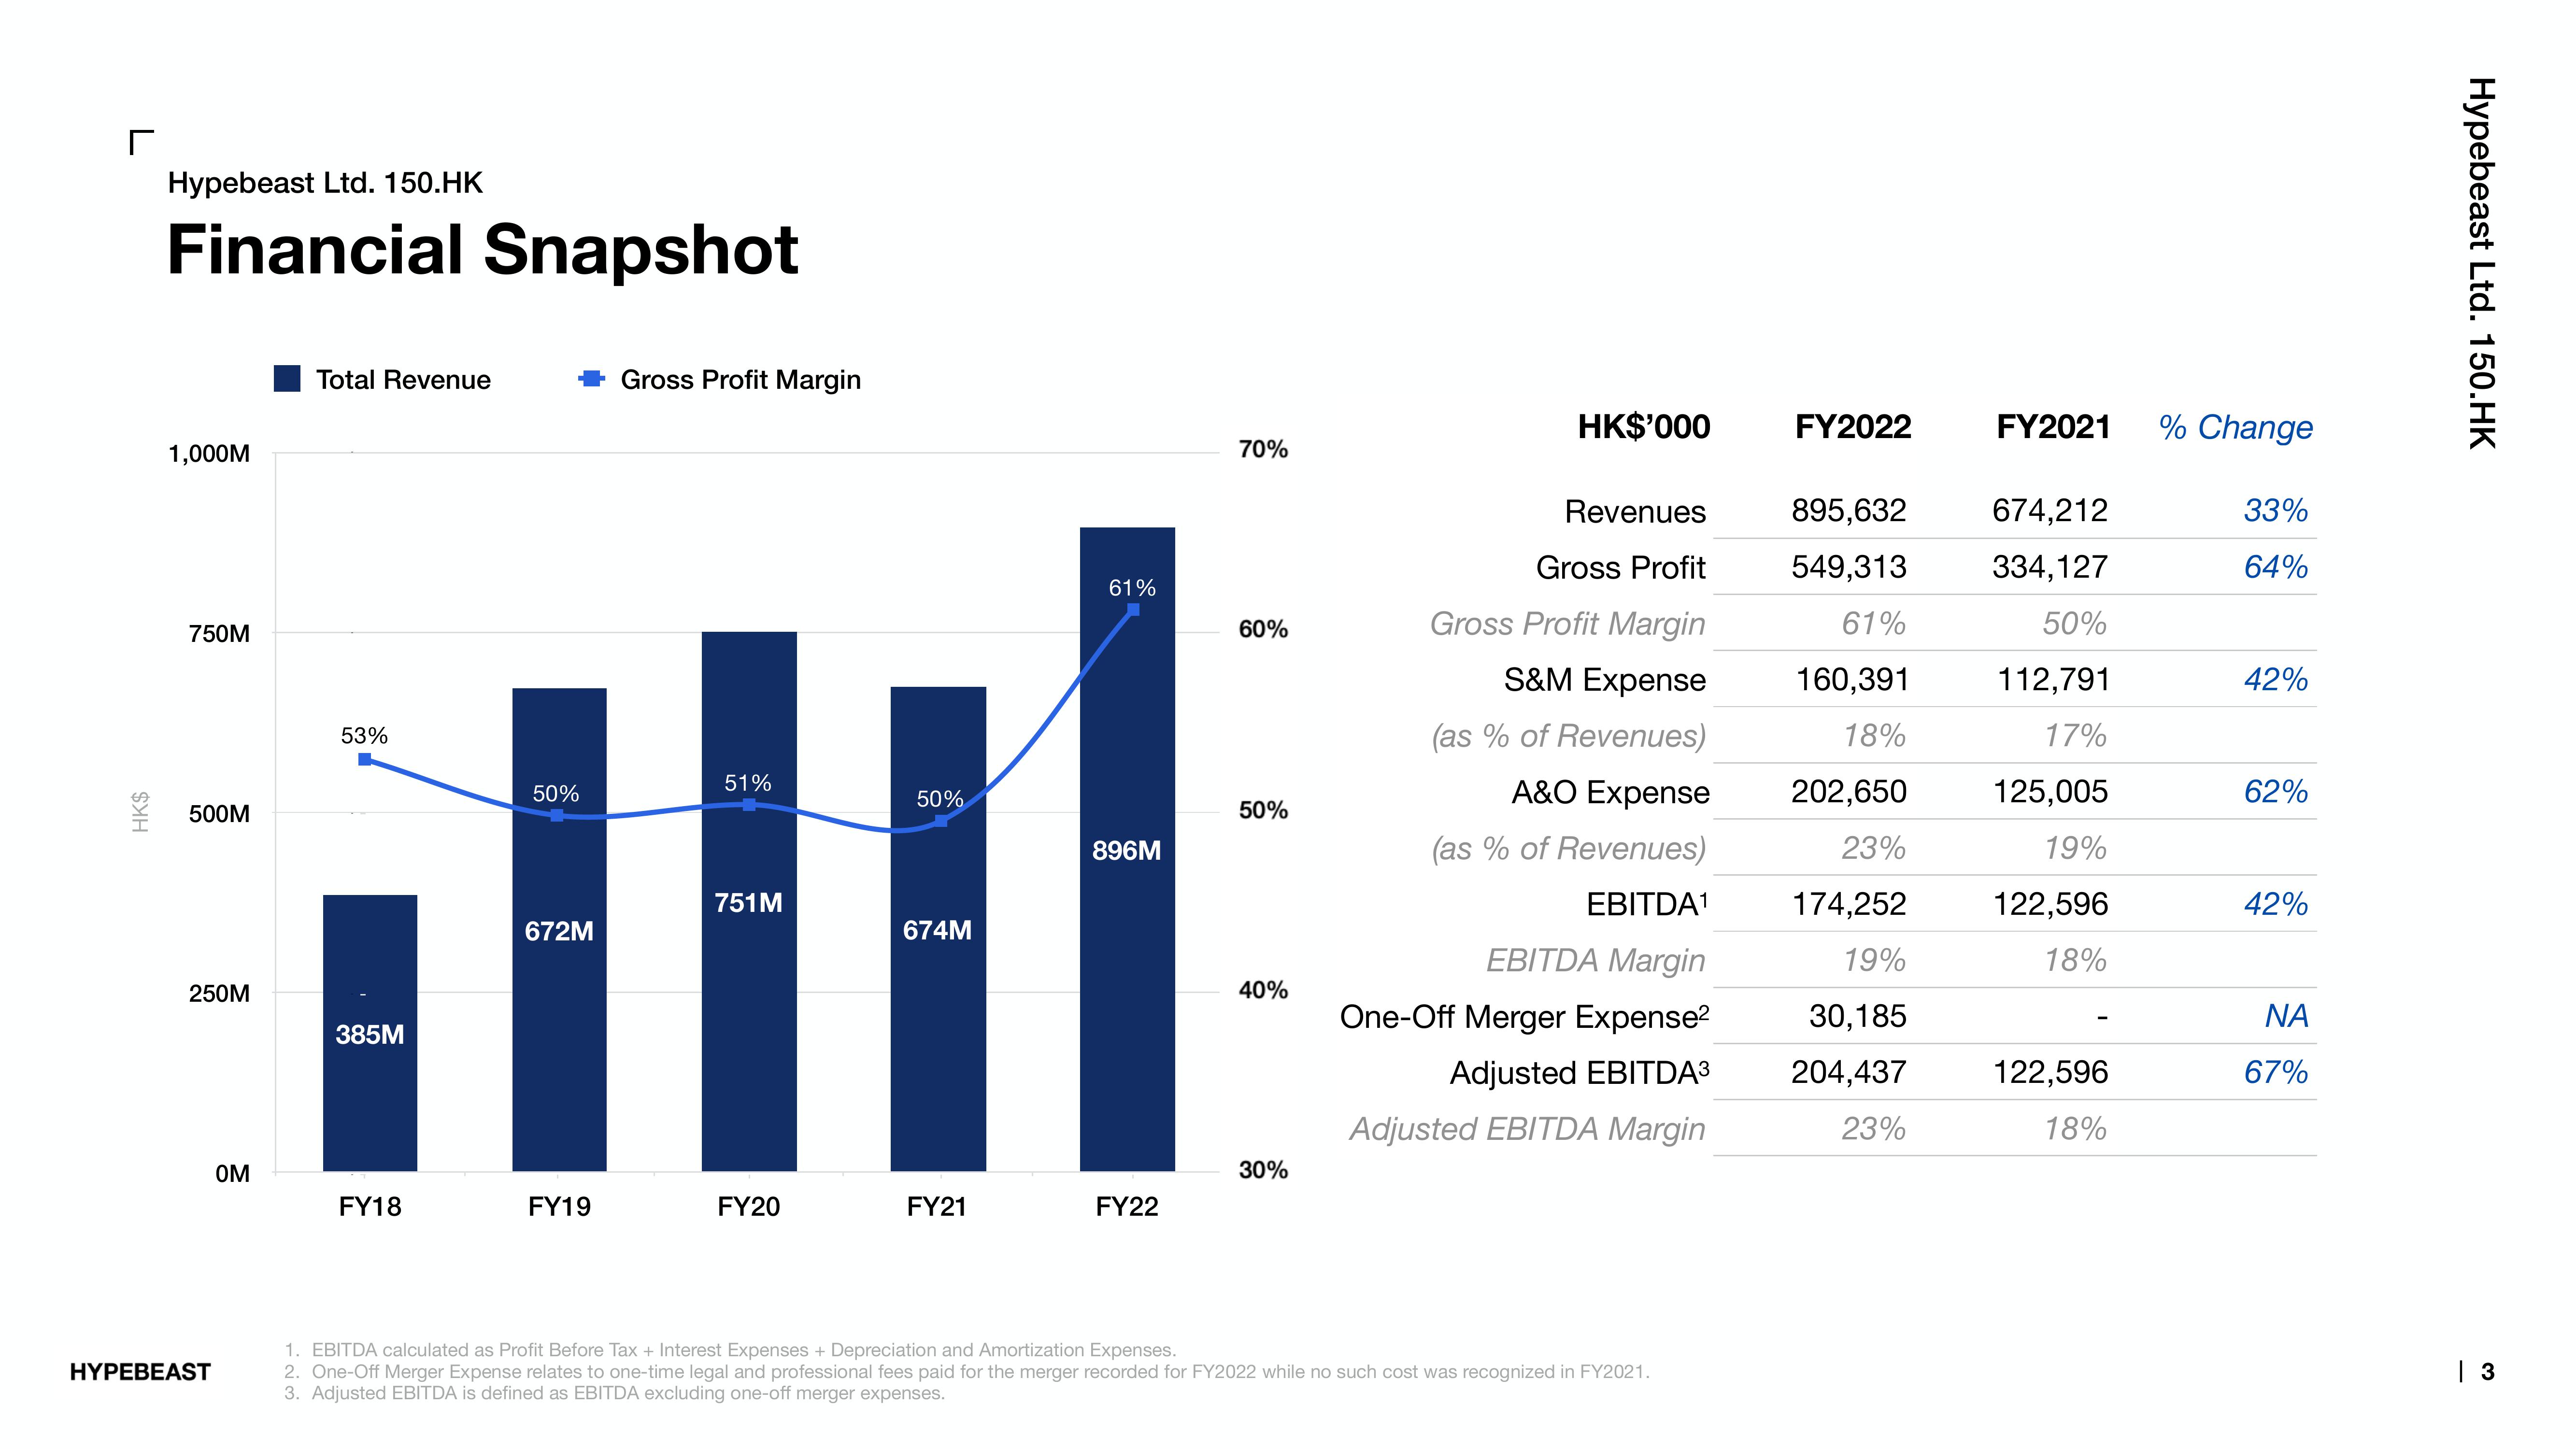
1. EBITDA calculated as Profit Before Tax + Interest Expenses + Depreciation and Amortization Expenses.
2. One-Off Merger Expense relates to one-time legal and professional fees paid for the merger recorded for FY2022 while no such cost was recognized in FY2021.
3. Adjusted EBITDA is defined as EBITDA excluding one-off merger expenses.
FY2022
895,632
549,313
61%
160,391
18%
202,650
23%
174,252
19%
30,185
204,437
23%
FY2021
674,212
334,127
50%
112,791
17%
125,005
19%
122,596
18%
122,596
18%
% Change
33%
64%
42%
62%
42%
ΝΑ
67%
Hypebeast Ltd. 150.HK
| 3View entire presentation