Brivo SPAC Presentation Deck
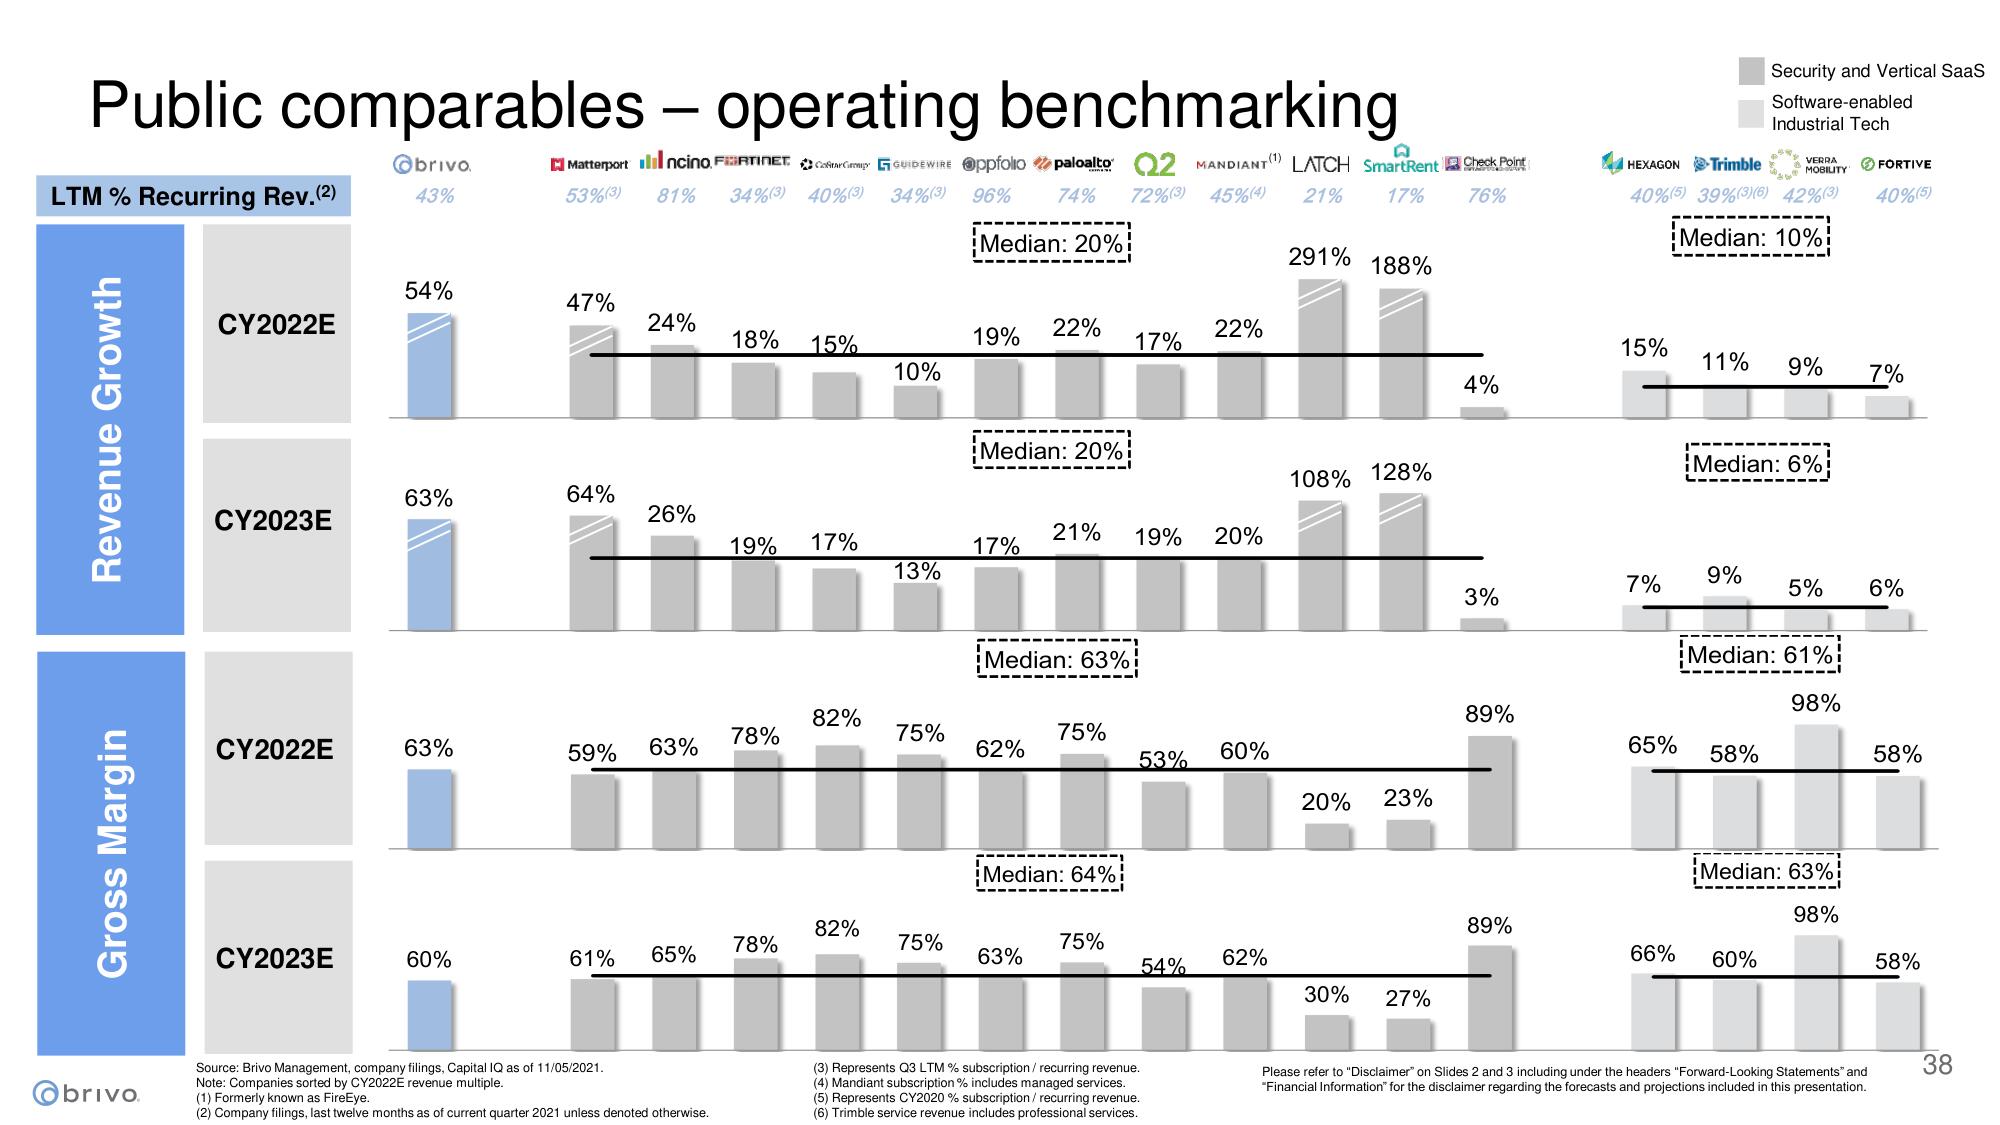
Public comparables - operating benchmarking
Matterport Ilincino. FIRTINET.Com GUIDEWIRE Oppfolio paloalto 2 MANDIANT(1) LATCH SmartRent Check Point
53% (3) 81% 34% (3) 40% (3) 34% (3) 96% 74% 72%(3) 45%(4) 21% 17% 76%
LTM % Recurring Rev. (²)
Median: 20%
291% 188%
Revenue Growth
Gross Margin
Obrivo
CY2022E
CY2023E
CY2022E
CY2023E
@brivo.
43%
54%
63%
47%
60%
64%
24%
26%
59% 63%
61% 65%
18%
Source: Brivo Management, company filings, Capital IQ as of 11/05/2021.
Note: Companies sorted by CY2022E revenue multiple.
(1) Formerly known as FireEye.
(2) Company filings, last twelve months as of current quarter 2021 unless denoted otherwise.
19%
78%
15%
78%
17%
82%
10%
82%
13%
19%
75%
Median: 20%
17%
22%
63%
21%
17%
75%
19%
54%
22%
(3) Represents Q3 LTM % subscription/ recurring revenue.
(4) Mandiant subscription % includes managed services.
(5) Represents CY2020 % subscription / recurring revenue.
(6) Trimble service revenue includes professional services.
20%
60%
108% 128%
11
62%
Median: 61%!
Median: 63%!
98%
75%
75%
65%
63%
62%
53%
58%
i miitid:=1 nh
Median: 64%!
Median: 63%!
98%
20%
23%
4%
30% 27%
3%
89%
HEXAGON-Trimble
89%
15%
40%(5) 39%(3)(6) 42%(3)
Median: 10%!
7%
11%
66%
Security and Vertical SaaS
Software-enabled
Industrial Tech
9%
VERRA
MORE IT
MOBILITY
Median: 6%
60%
9%
5%
FORTIVE
40%(5)
Please refer to "Disclaimer" on Slides 2 and 3 including under the headers "Forward-Looking Statements and
"Financial Information for the disclaimer regarding the forecasts and projections included in this presentation.
7%
6%
58%
58%
38View entire presentation