Antero Midstream Partners Mergers and Acquisitions Presentation Deck
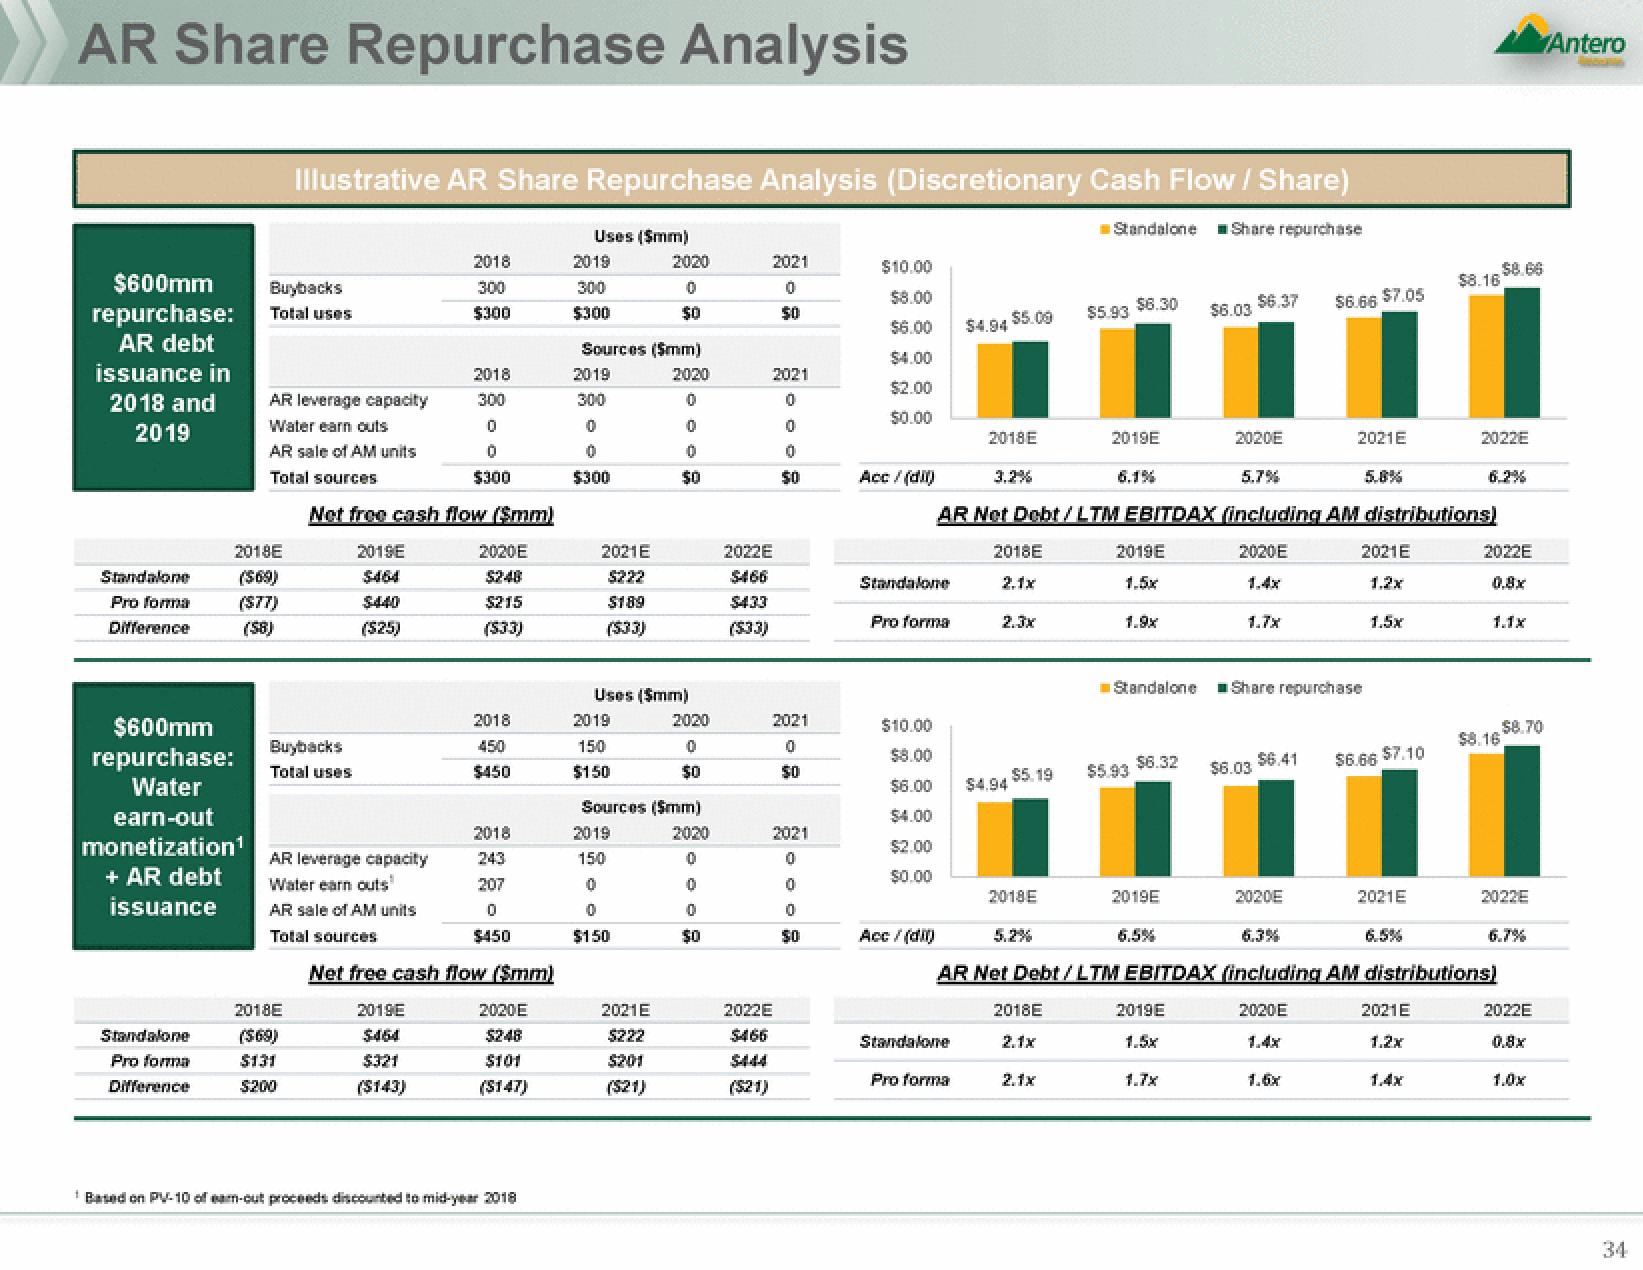
AR Share Repurchase Analysis
$600mm
repurchase:
AR debt
issuance in
2018 and
2019
Standalone
Pro forma
Difference
$600mm
repurchase:
Water
earn-out
monetization¹
+ AR debt
issuance
Standalone
Pro forma
Difference
Buybacks
Total uses
2018E
($69)
($77)
(S8)
Illustrative AR Share Repurchase Analysis (Discretionary Cash Flow / Share)
Share repurchase
AR leverage capacity
Water earn outs
AR sale of AM units
Total sources
Buybacks
Total uses
2018E
($69)
$131
$200
Net free cash flow (Smm)
2019E
($25)
AR leverage capacity
Water earn outs
AR sale of AM units
Total sources
2018
300
$300
2018
300
0
10
$300
2020E
$215
(533)
2018
450
$450
2018
243
207
0
$450
Net free cash flow (Smm)
2019E
$464
$321
2020E
$248
$101
($147)
*Based on PV-10 of eam-out proceeds discounted to mid-year 2018
Uses ($mm)
2019
300
$300
Sources ($mm)
2020
0
0
2019
300
0
0
$300
2021E
$222
$189
2019
150
$150
2020
0
50
Uses ($mm)
2019
150
0
0
$150
10
50
2021E
$222
$201
($21)
Sources ($mm)
2020
0
0
0
$0
2020
0
50
2022E
$433
($33)
2021
0
$0
2021
0
0
0
50
($21)
|||
2021
0
$0
2022E
$466
2021
0
0
0
$10.00
$8.00
$2.00
$0.00
Acc/(dil)
Standalone
Pro forma
$10.00
$6.00
$4.00
$0.00
Acc/(di)
$4.94 $5.00
Standalone
2018E
3.2%
Pro forma
2018E
$4.94
$5.19
2018E
5.2%
Standalone
2018E
2.1x
$5.93 $6.30
AR Net Debt / LTM EBITDAX (including AM distributions)
2020E
1.4x
2.1x
2019E
2019E
1.5x
Standalone
$5.93
$6.32
2019E
6.5%
$6.03
2019E
1.7x
$6.37
2020E
5.7%
1.7x
$6.03
$6.66 $7.05
2021E
$6.41
Share repurchase
2020E
6.3%
AR Net Debt / LTM EBITDAX (including AM distributions)
2020E
5.8%
2021E
1.2x
1.5x
$6.66 $7.10
$8.16
2021E
2021E
1.2x
2022E
$8.66
2022E
0.8x
$8.16
$8.70
2022E
6.7%
2022E
0.8x
Antero
34View entire presentation