Enact IPO Presentation Deck
Enact | Investor Presentation
In-Force and Premium Growth Compares Favorably
vs. Peers
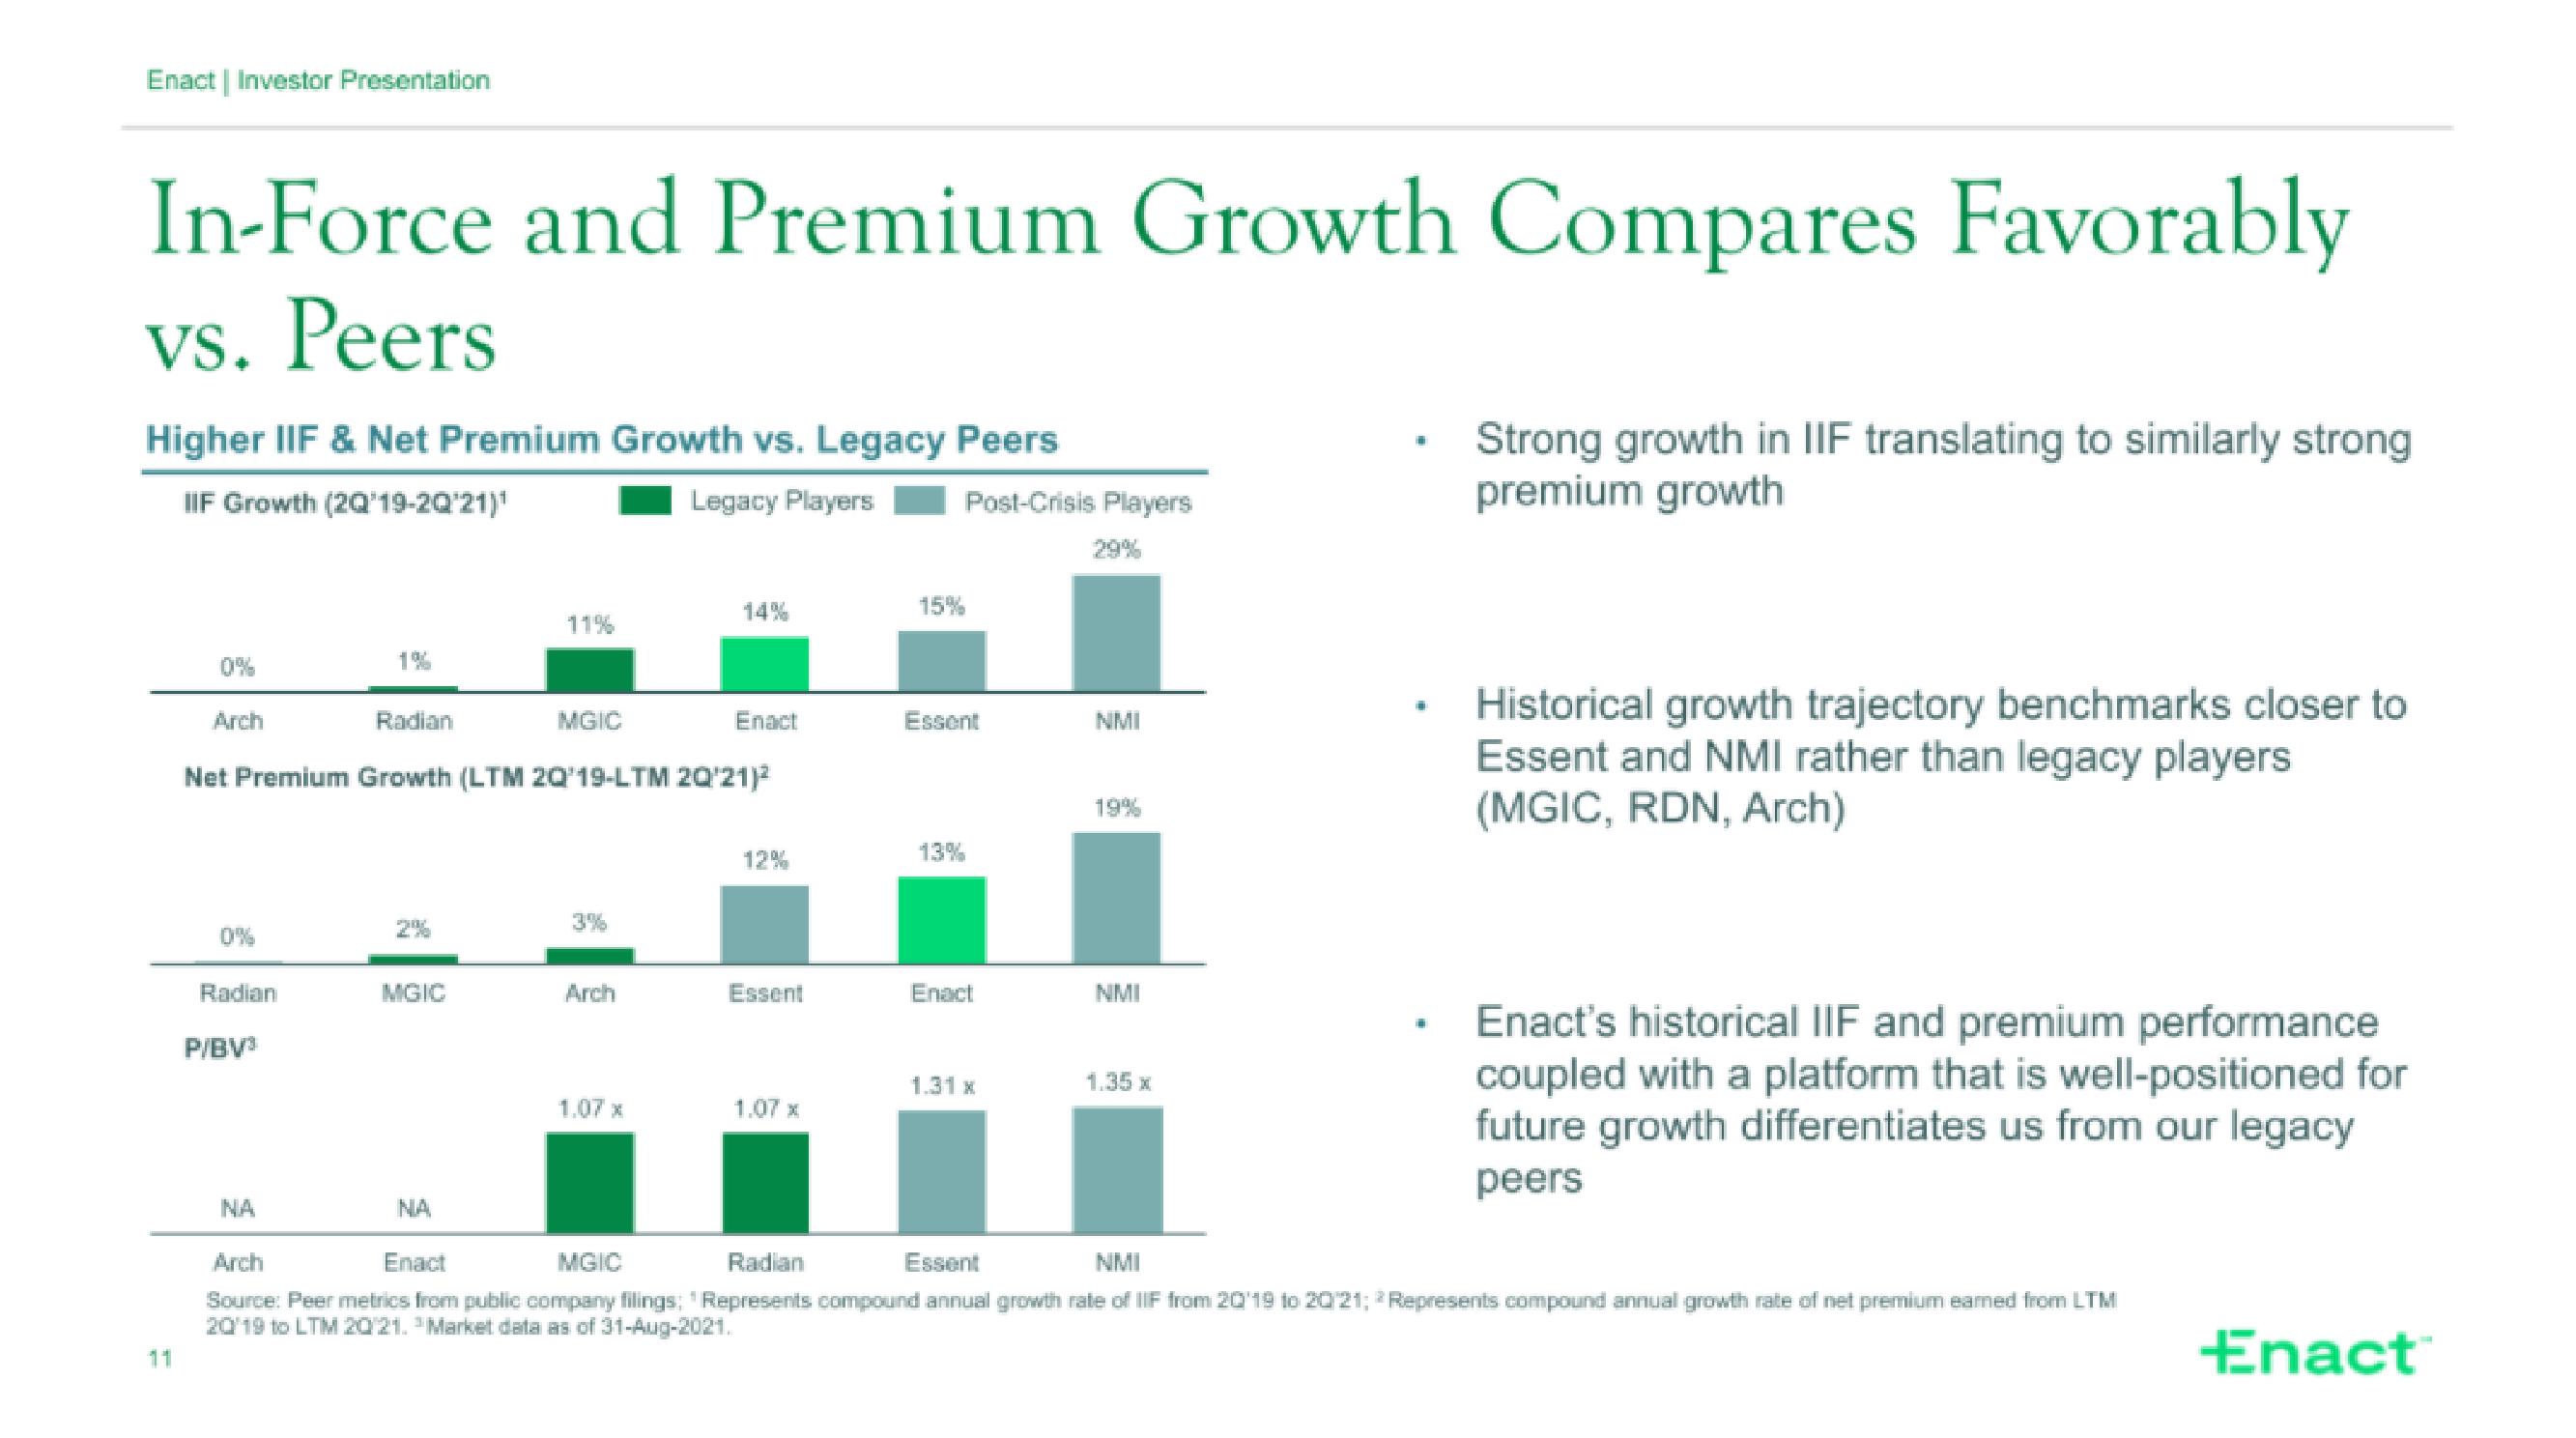
Higher IIF & Net Premium Growth vs. Legacy Peers
IIF Growth (2Q'19-2Q'21)¹
Legacy Players
11
0%
Radian
P/BV³
1%
NA
Radian
Net Premium Growth (LTM 20′19-LTM 20′21)²
MGIC
11%
NA
MGIC
Arch
Enact
1.07 x
12%
Essent
1.07 x
15%
Post-Crisis Players
Essent
13%
Enact
1.31 x
NMI
19%
NMI
1.35 x
#
Strong growth in IIF translating to similarly strong
premium growth
Historical growth trajectory benchmarks closer to
Essent and NMI rather than legacy players
(MGIC, RDN, Arch)
Enact's historical IIF and premium performance
coupled with a platform that is well-positioned for
future growth differentiates us from our legacy
peers
Arch
Enact
Radian
Essent
NMI
Source: Peer metrics from public company filings; "Represents compound annual growth rate of IIF from 2019 to 20/21; Represents compound annual growth rate of net premium earned from LTM
2019 to LTM 20/21. Market data as of 31-Aug-2021.
Enact™View entire presentation