Netstreit Investor Presentation Deck
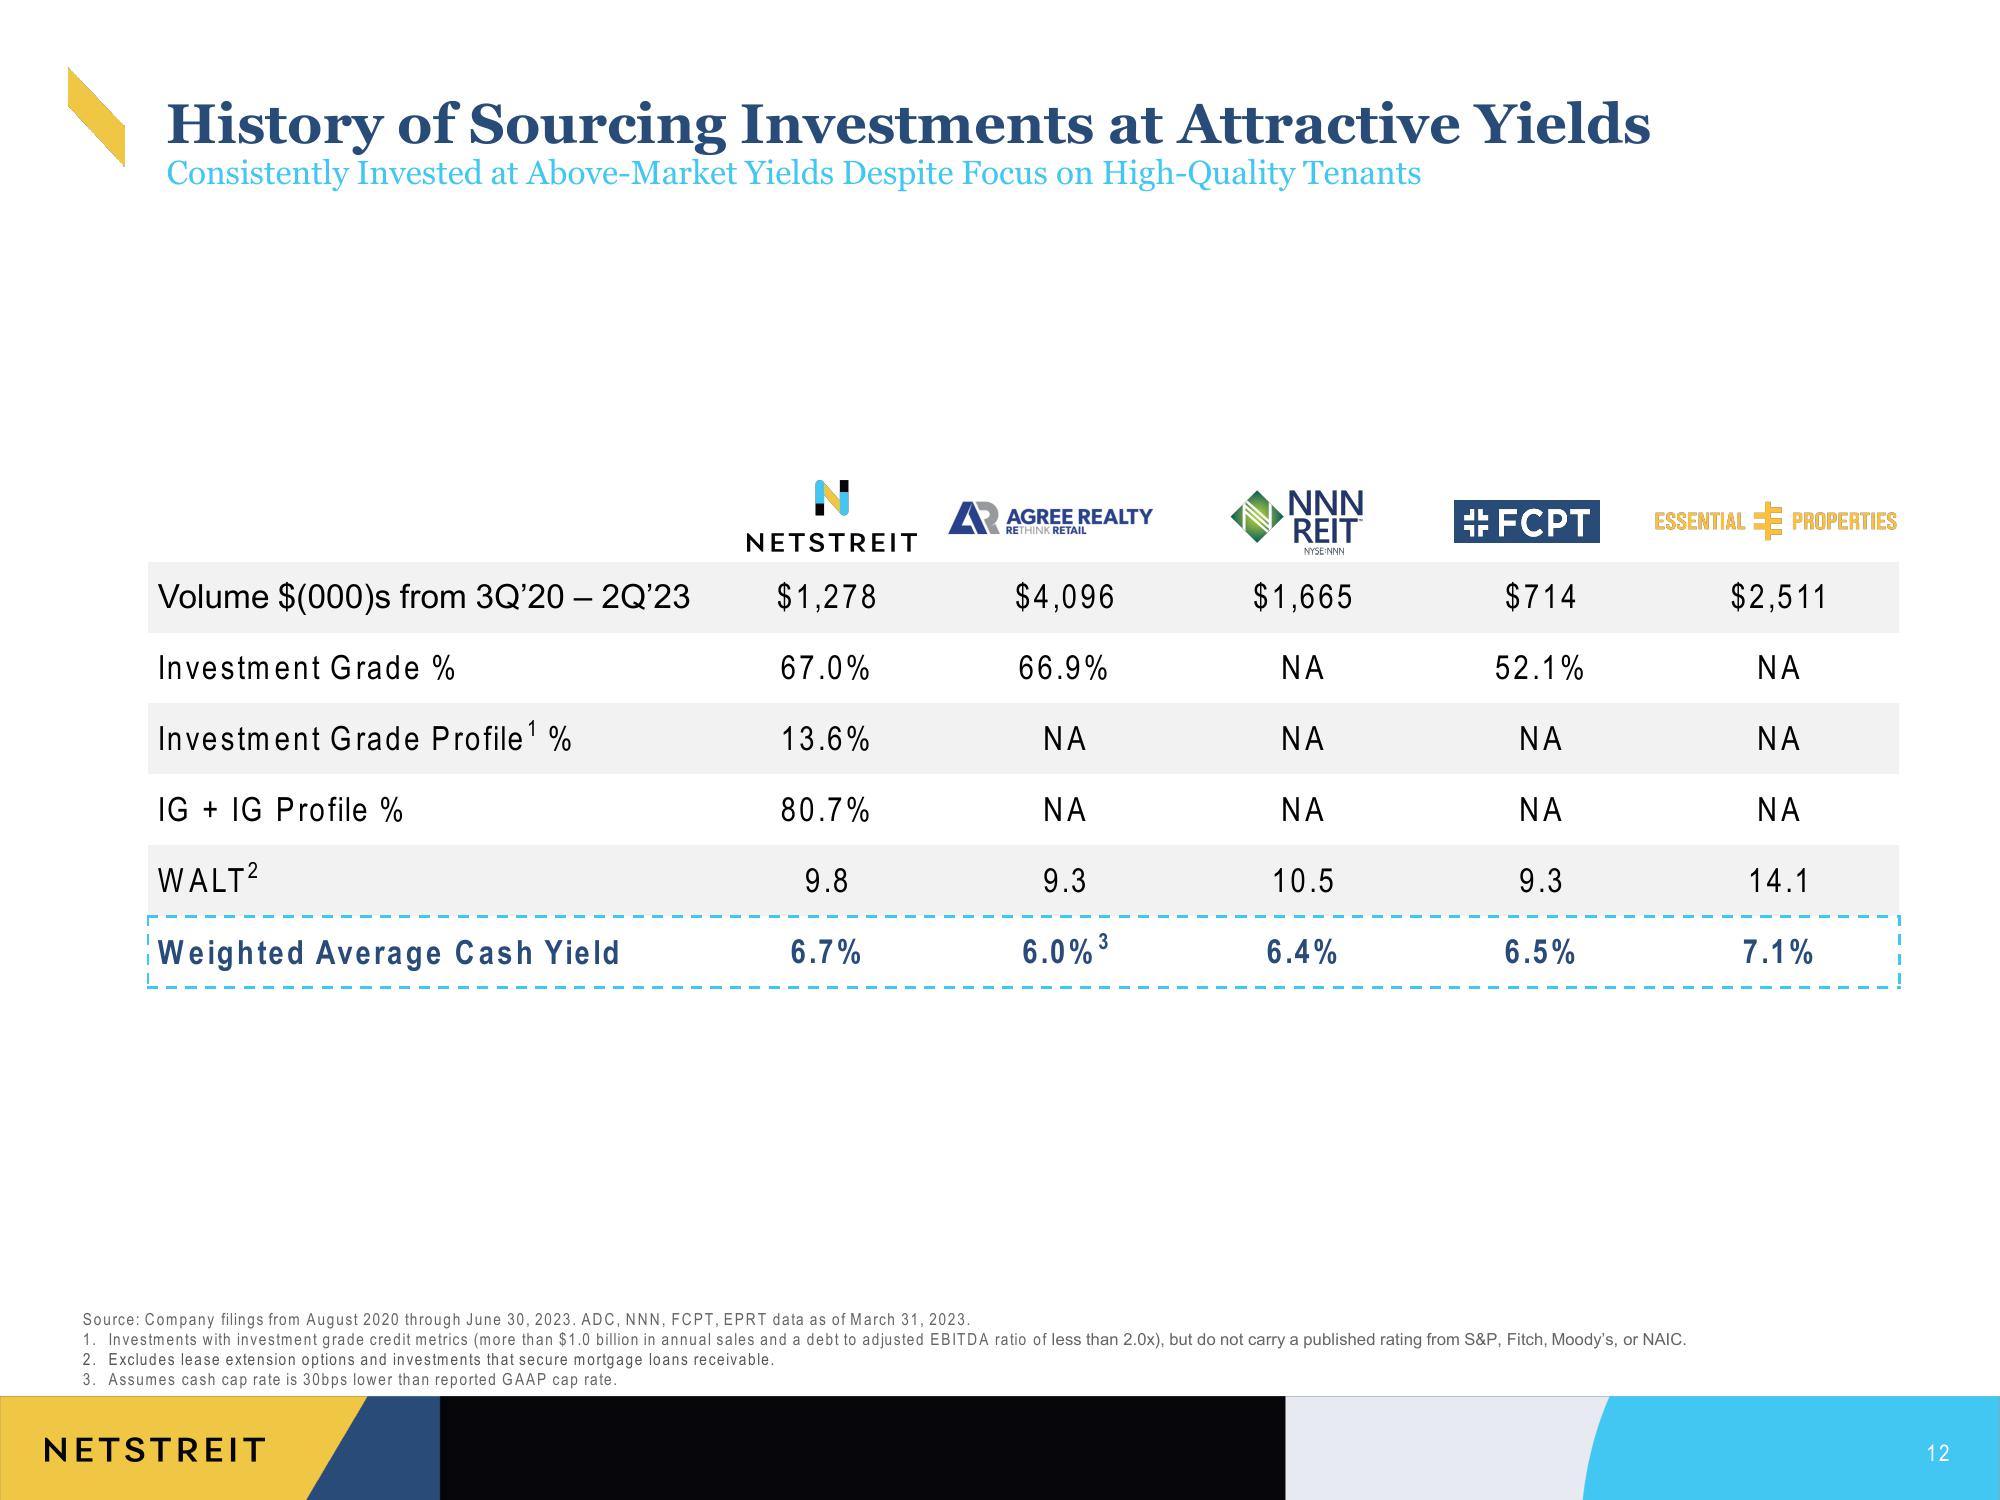
History of Sourcing Investments at Attractive Yields
Consistently Invested at Above-Market Yields Despite Focus on High-Quality Tenants
Volume $(000)s from 3Q'20 - 2Q'23
Investment Grade %
Investment Grade Profile ¹ %
IG IG Profile %
WALT²
Weighted Average Cash Yield
NETSTREIT
$1,278
67.0%
NETSTREIT
13.6%
80.7%
9.8
6.7%
AR AGREE REALTY
RETHINK RETAIL
$4,096
66.9%
ΝΑ
ΝΑ
9.3
3
6.0% ³
NNN
REIT
NYSE:NNN
$1,665
ΝΑ
ΝΑ
ΝΑ
10.5
6.4%
#FCPT
$714
52.1%
ΝΑ
ΝΑ
9.3
6.5%
ESSENTIAL PROPERTIES
Source: Company filings from August 2020 through June 30, 2023. ADC, NNN, FCPT, EPRT data as of March 31, 2023.
1. Investments with investment grade credit metrics (more than $1.0 billion in annual sales and a debt to adjusted EBITDA ratio of less than 2.0x), but do not carry a published rating from S&P, Fitch, Moody's, or NAIC.
2. Excludes lease extension options and investments that secure mortgage loans receivable.
3. Assumes cash cap rate is 30bps lower than reported GAAP cap rate.
$2,511
ΝΑ
ΝΑ
ΝΑ
14.1
7.1%
12View entire presentation