BlackRock Results Presentation Deck
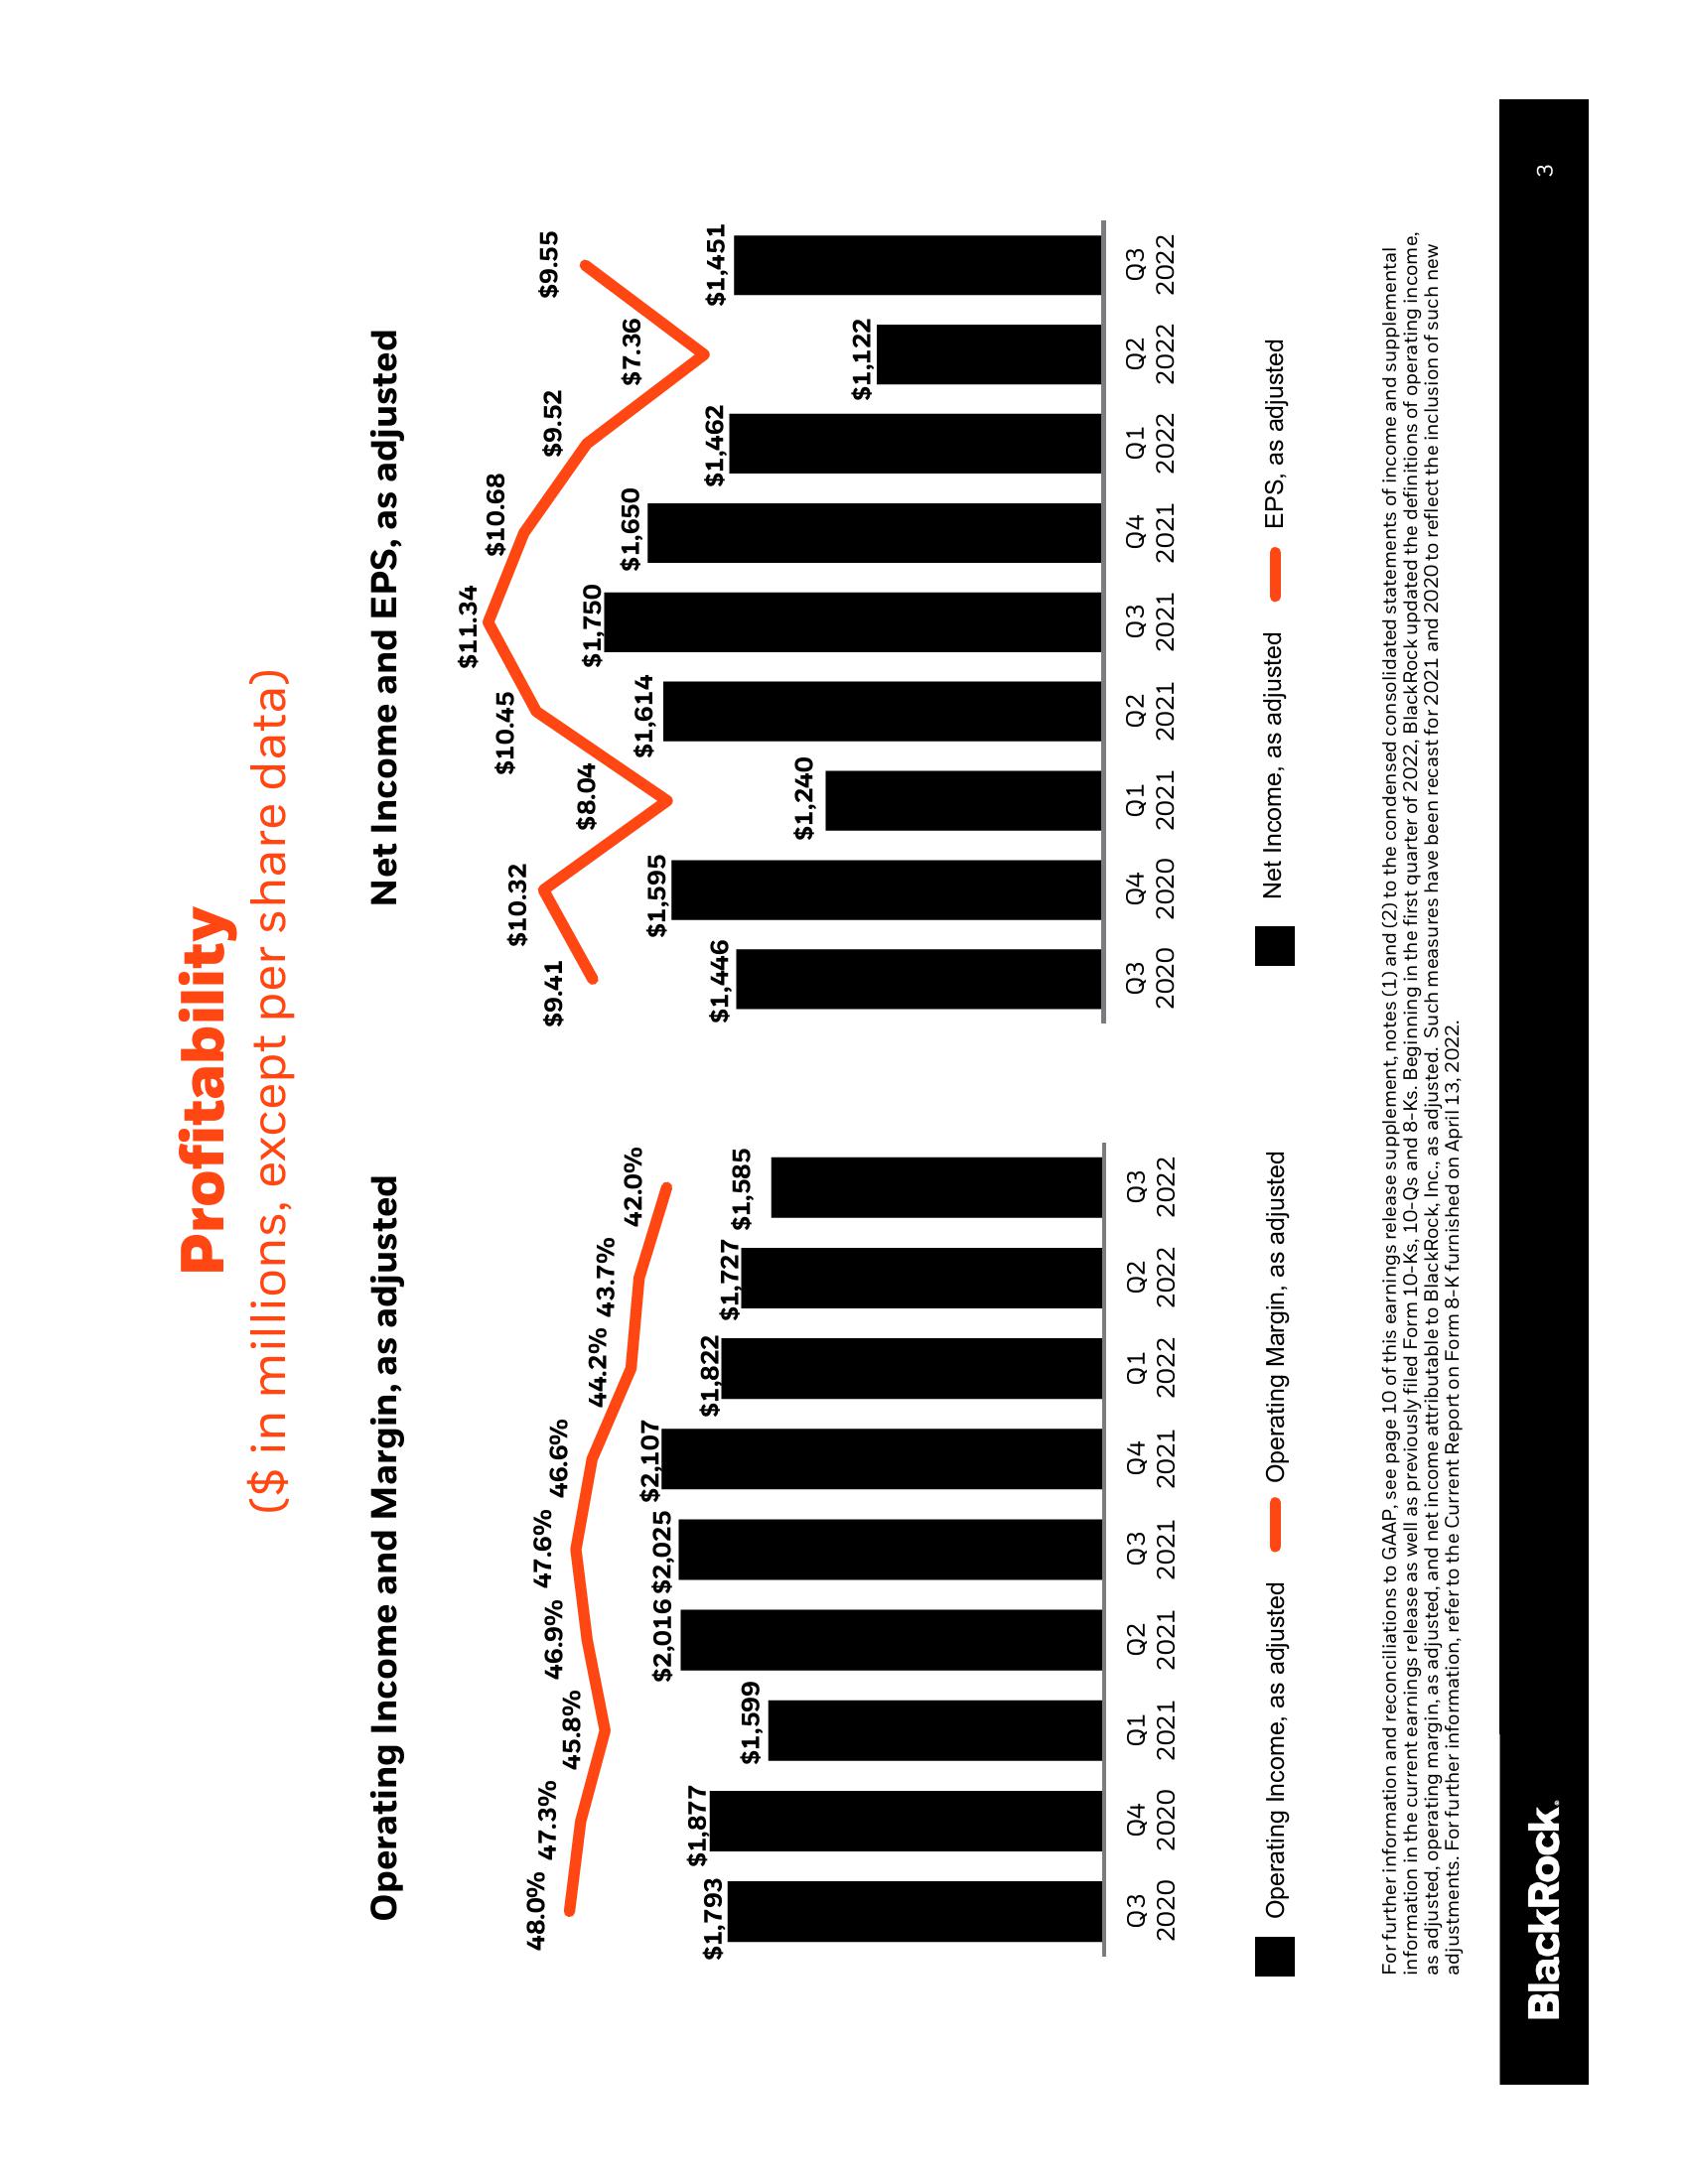
Operating Income and Margin, as adjusted
48.0%
$1,793
47.3%
$1,877
45.8%
46.9%
$1,599
BlackRock.
Q3 Q4 Q1 Q2
2020 2020 2021 2021
47.6%
$2,016 $2,025
Operating Income, as adjusted
Profitability
($ in millions, except per share data)
Q3
2021
46.6%
$2,107
44.2% 43.7%
$1,822
$1,727
42.0%
$1,585
Q4
Q1 Q2 Q3
2021 2022 2022 2022
Operating Margin, as adjusted
$9.41
Net Income and EPS, as adjusted
$10.32
$1,446
$1,595
$10.45
$8.04
$11.34
Q3 Q4
Q2 Q3
Q1
2020 2020 2021 2021 2021
$10.68
Net Income, as adjusted
$9.52
$1,750
$1,650
$7.36
$1,614
$1,462
$1,240
AllM
$1,122
$9.55
EPS, as adjust
$1,451
Q4 Q1 Q2 Q3
2021 2022 2022 2022
For further information and reconciliations to GAAP, see page 10 of this earnings release supplement, notes (1) and (2) to the condensed consolidated statements of income and supplemental
information in the current earnings release as well as previously filed Form 10-Ks, 10-Qs and 8-Ks. Beginning in the first quarter of 2022, BlackRock updated the definitions of operating income,
as adjusted, operating margin, as adjusted, and net income attributable to BlackRock, Inc., as adjusted. Such measures have been recast for 2021 and 2020 to reflect the inclusion of such new
adjustments. For further information, refer to the Current Report on Form 8-K furnished on April 13, 2022.
3View entire presentation