Antofagasta Results Presentation Deck
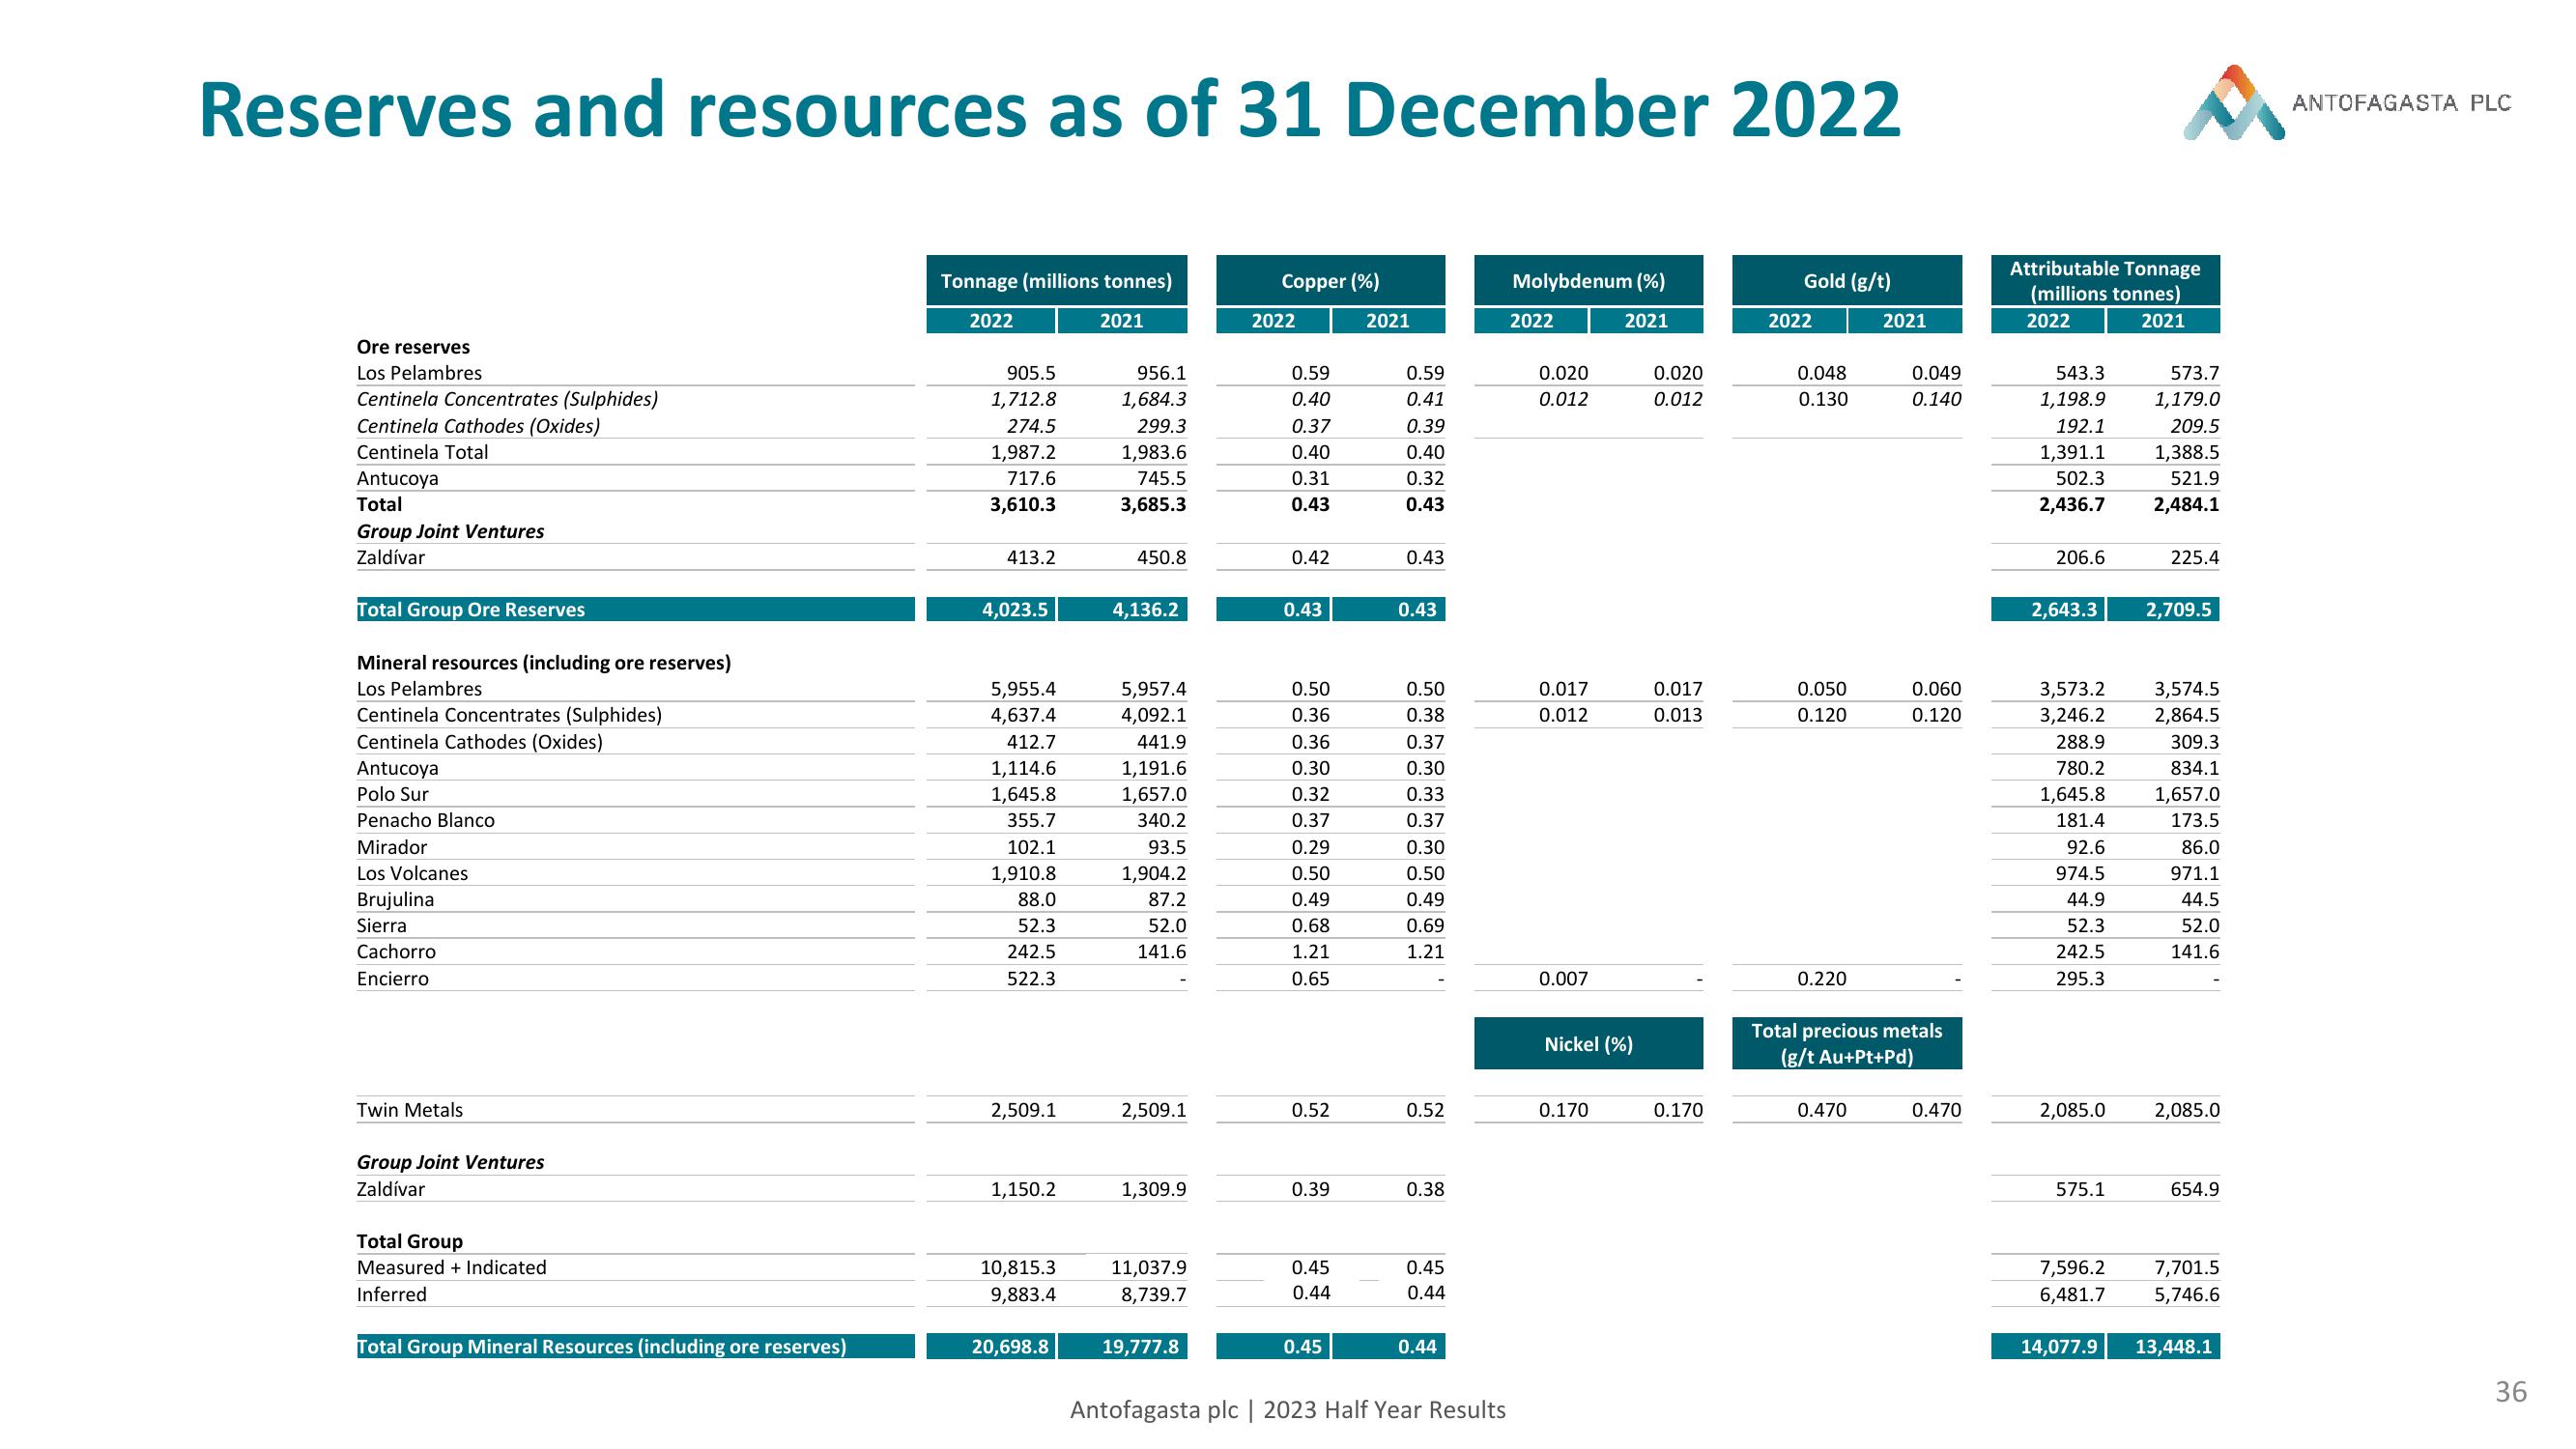
Reserves and resources as of 31 December 2022
Ore reserves
Los Pelambres
Centinela Concentrates (Sulphides)
Centinela Cathodes (Oxides)
Centinela Total
Antucoya
Total
Group Joint Ventures
Zaldívar
Total Group Ore Reserves
Mineral resources (including ore reserves)
Los Pelambres
Centinela Concentrates (Sulphides)
Centinela Cathodes (Oxides)
Antucoya
Polo Sur
Penacho Blanco
Mirador
Los Volcanes
Brujulina
Sierra
Cachorro
Encierro
Twin Metals
Group Joint Ventures
Zaldívar
Total Group
Measured + Indicated
Inferred
Total Group Mineral Resources (including ore reserves)
Tonnage (millions tonnes)
2022
2021
905.5
1,712.8
274.5
1,987.2
717.6
3,610.3
413.2
4,023.5
5,955.4
4,637.4
412.7
1,114.6
1,645.8
355.7
102.1
1,910.8
88.0
52.3
242.5
522.3
2,509.1
1,150.2
10,815.3
9,883.4
20,698.8
956.1
1,684.3
299.3
1,983.6
745.5
3,685.3
450.8
4,136.2
5,957.4
4,092.1
441.9
1,191.6
1,657.0
340.2
93.5
1,904.2
87.2
52.0
141.6
2,509.1
1,309.9
11,037.9
8,739.7
19,777.8
Copper (%)
2022
0.59
0.40
0.37
0.40
0.31
0.43
0.42
0.43
0.50
0.36
0.36
0.30
0.32
0.37
0.29
0.50
0.49
0.68
1.21
0.65
0.52
0.39
0.45
0.44
0.45
2021
0.59
0.41
0.39
0.40
0.32
0.43
0.43
0.43
0.50
0.38
0.37
0.30
0.33
0.37
0.30
0.50
0.49
0.69
1.21
0.52
0.38
0.45
0.44
0.44
Antofagasta plc | 2023 Half Year Results
Molybdenum (%)
2021
2022
0.020
0.012
0.017
0.012
0.007
Nickel (%)
0.170
0.020
0.012
0.017
0.013
0.170
Gold (g/t)
2022
0.048
0.130
0.050
0.120
0.220
2021
0.470
0.049
0.140
0.060
0.120
Total precious metals
(g/t Au+Pt+Pd)
0.470
Attributable Tonnage
(millions tonnes)
2022
2021
543.3
1,198.9
573.7
1,179.0
192.1
209.5
1,391.1 1,388.5
502.3
521.9
2,436.7 2,484.1
206.6
2,643.3
3,573.2
3,246.2
288.9
780.2
1,645.8
181.4
92.6
974.5
44.9
52.3
242.5
295.3
2,085.0
575.1
7,596.2
6,481.7
14,077.9
225.4
2,709.5
3,574.5
2,864.5
309.3
834.1
1,657.0
173.5
86.0
971.1
44.5
52.0
141.6
2,085.0
654.9
7,701.5
5,746.6
13,448.1
ANTOFAGASTA PLC
36View entire presentation