Investor Presentation
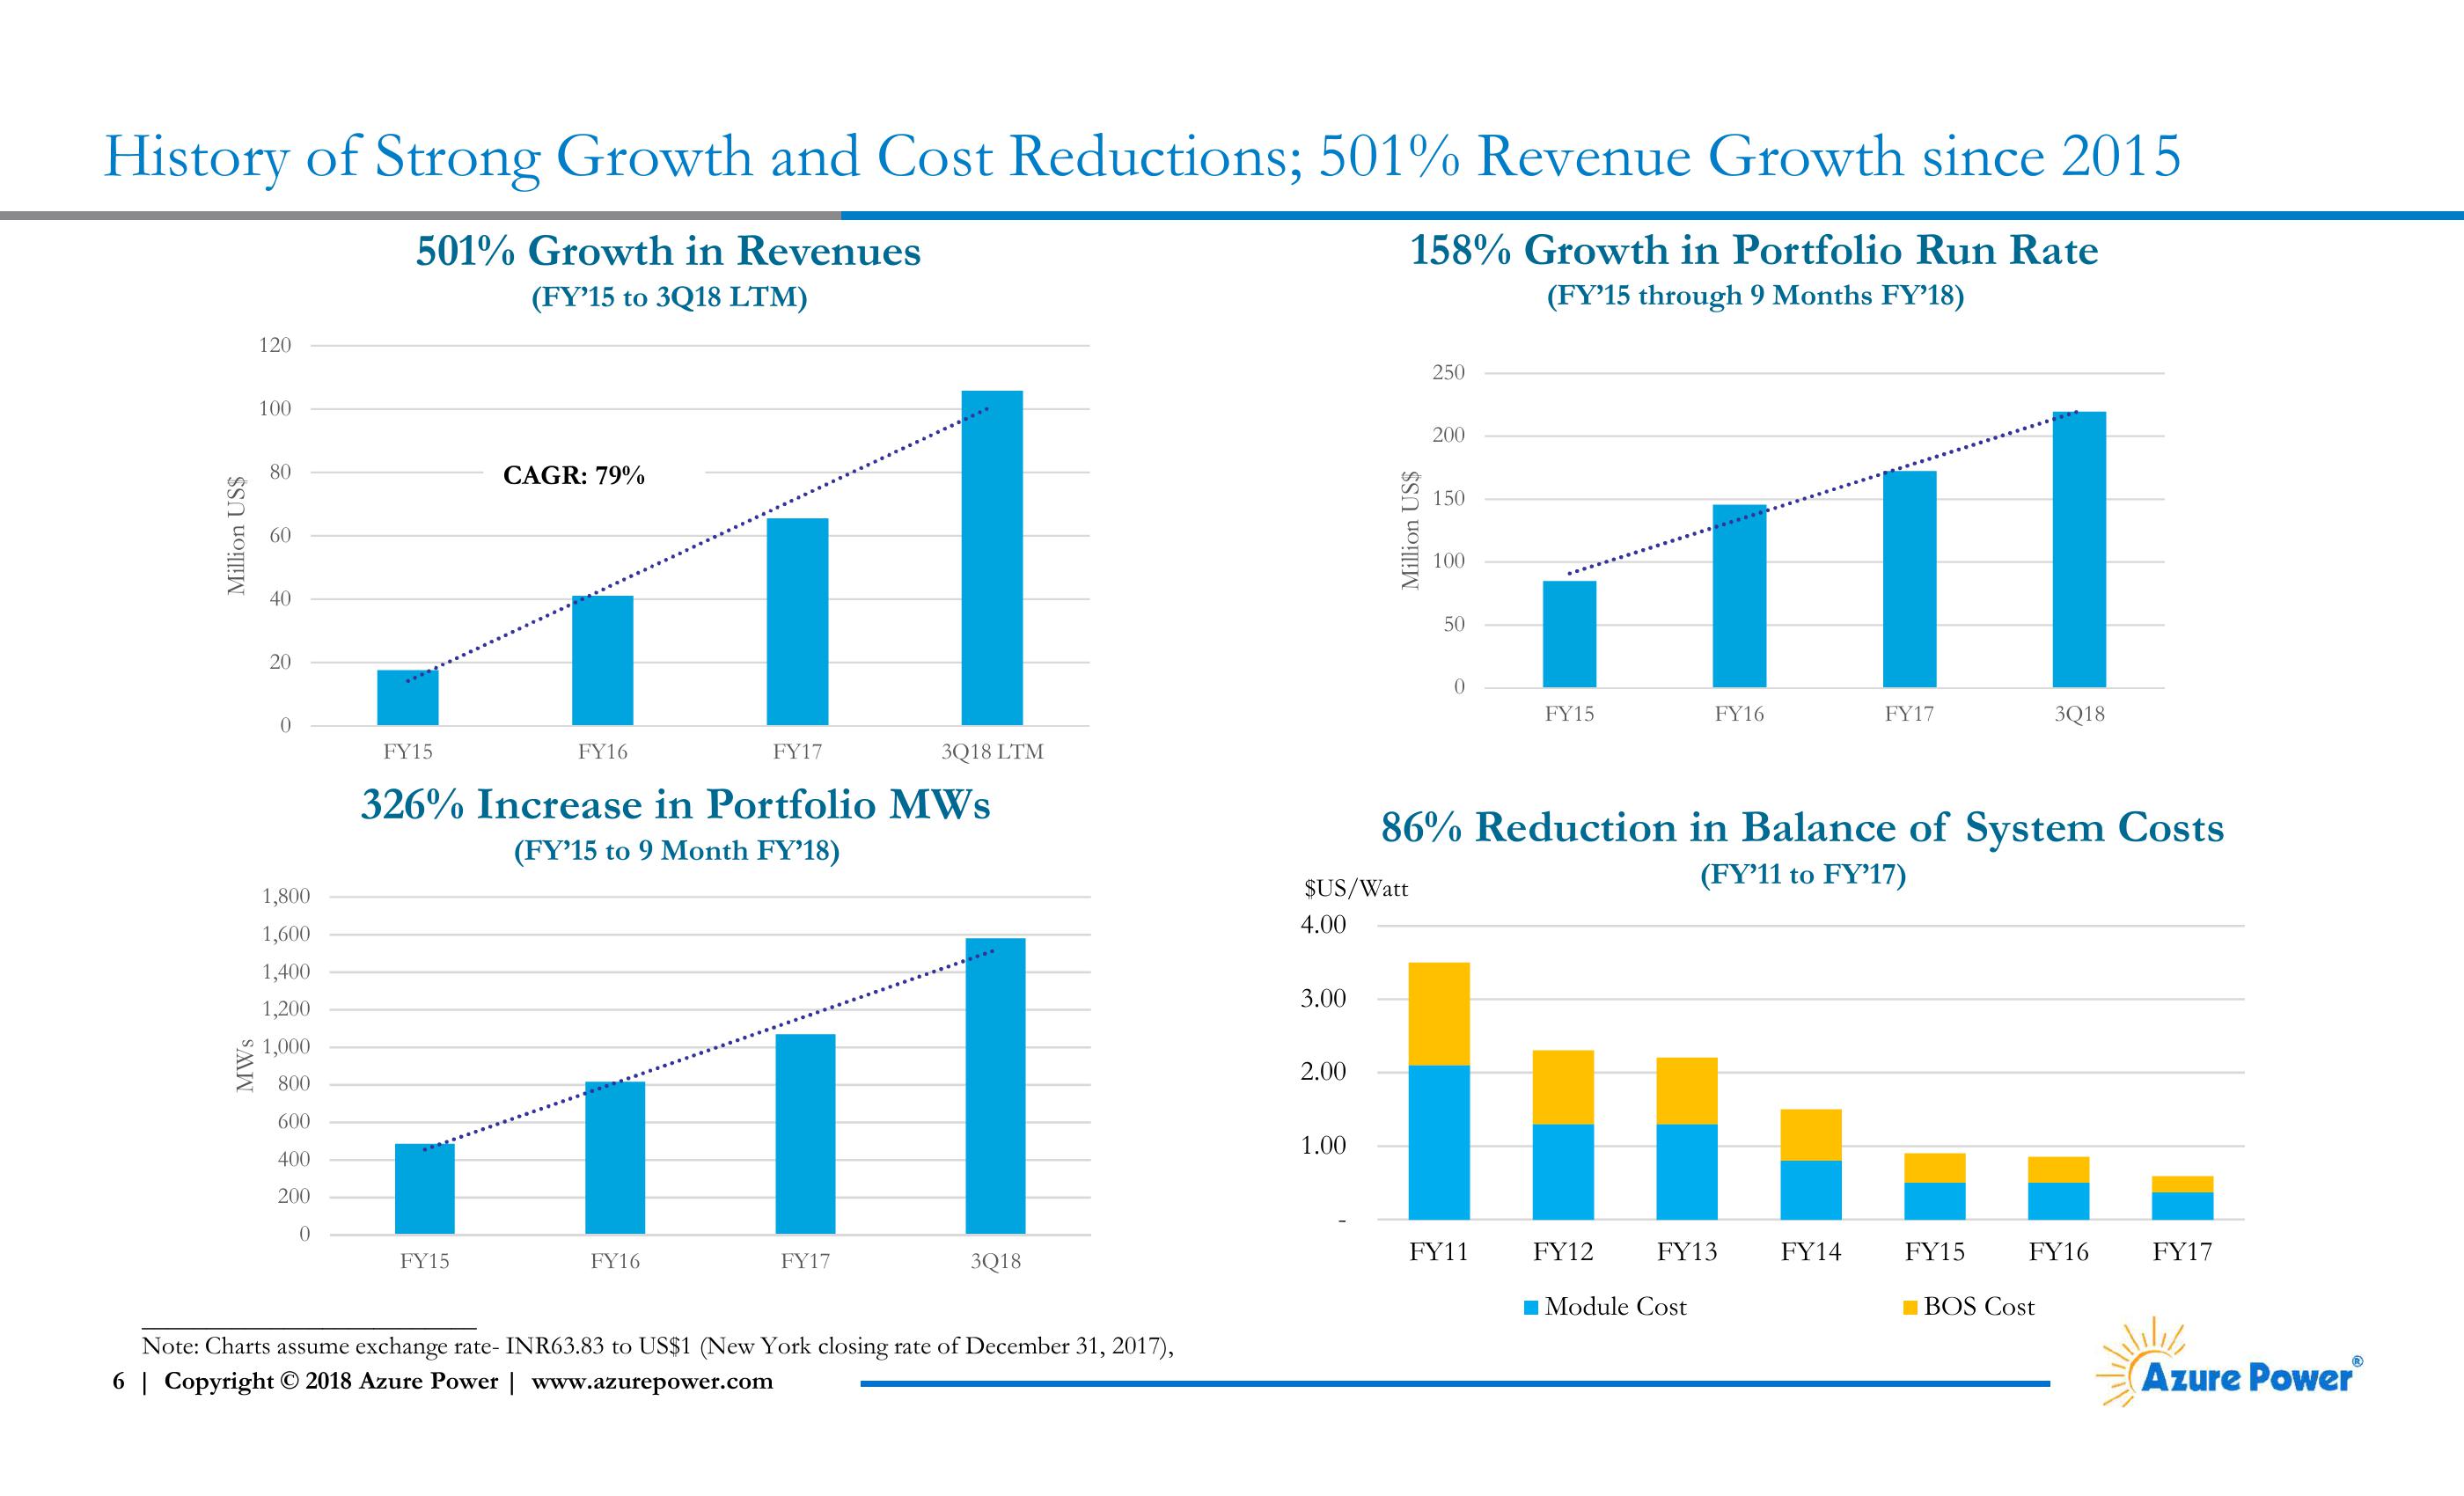
History of Strong Growth and Cost Reductions; 501% Revenue Growth since 2015
501% Growth in Revenues
(FY'15 to 3Q18 LTM)
158% Growth in Portfolio Run Rate
(FY'15 through 9 Months FY'18)
MWs
Million US$
12080
120
100
80
60
40
20
0
FY15
CAGR: 79%
FY16
FY17
3Q18 LTM
326% Increase in Portfolio MWs
(FY'15 to 9 Month FY'18)
1,800
1,600
1,400
1,200
1,000
800
600
400
200
0
FY15
FY16
FY17
3Q18
Note: Charts assume exchange rate- INR63.83 to US$1 (New York closing rate of December 31, 2017),
6 | Copyright © 2018 Azure Power | www.azurepower.com
Million US$
250
200
150
100
50
0
FY15
FY16
FY17
3Q18
86% Reduction in Balance of System Costs
(FY'11 to FY'17)
$US/Watt
4.00
3.00
2.00
1.00
FY11
FY12
FY13
FY14
FY15
FY16
FY17
■Module Cost
BOS Cost
Azure PowerⓇView entire presentation