Baird Investment Banking Pitch Book
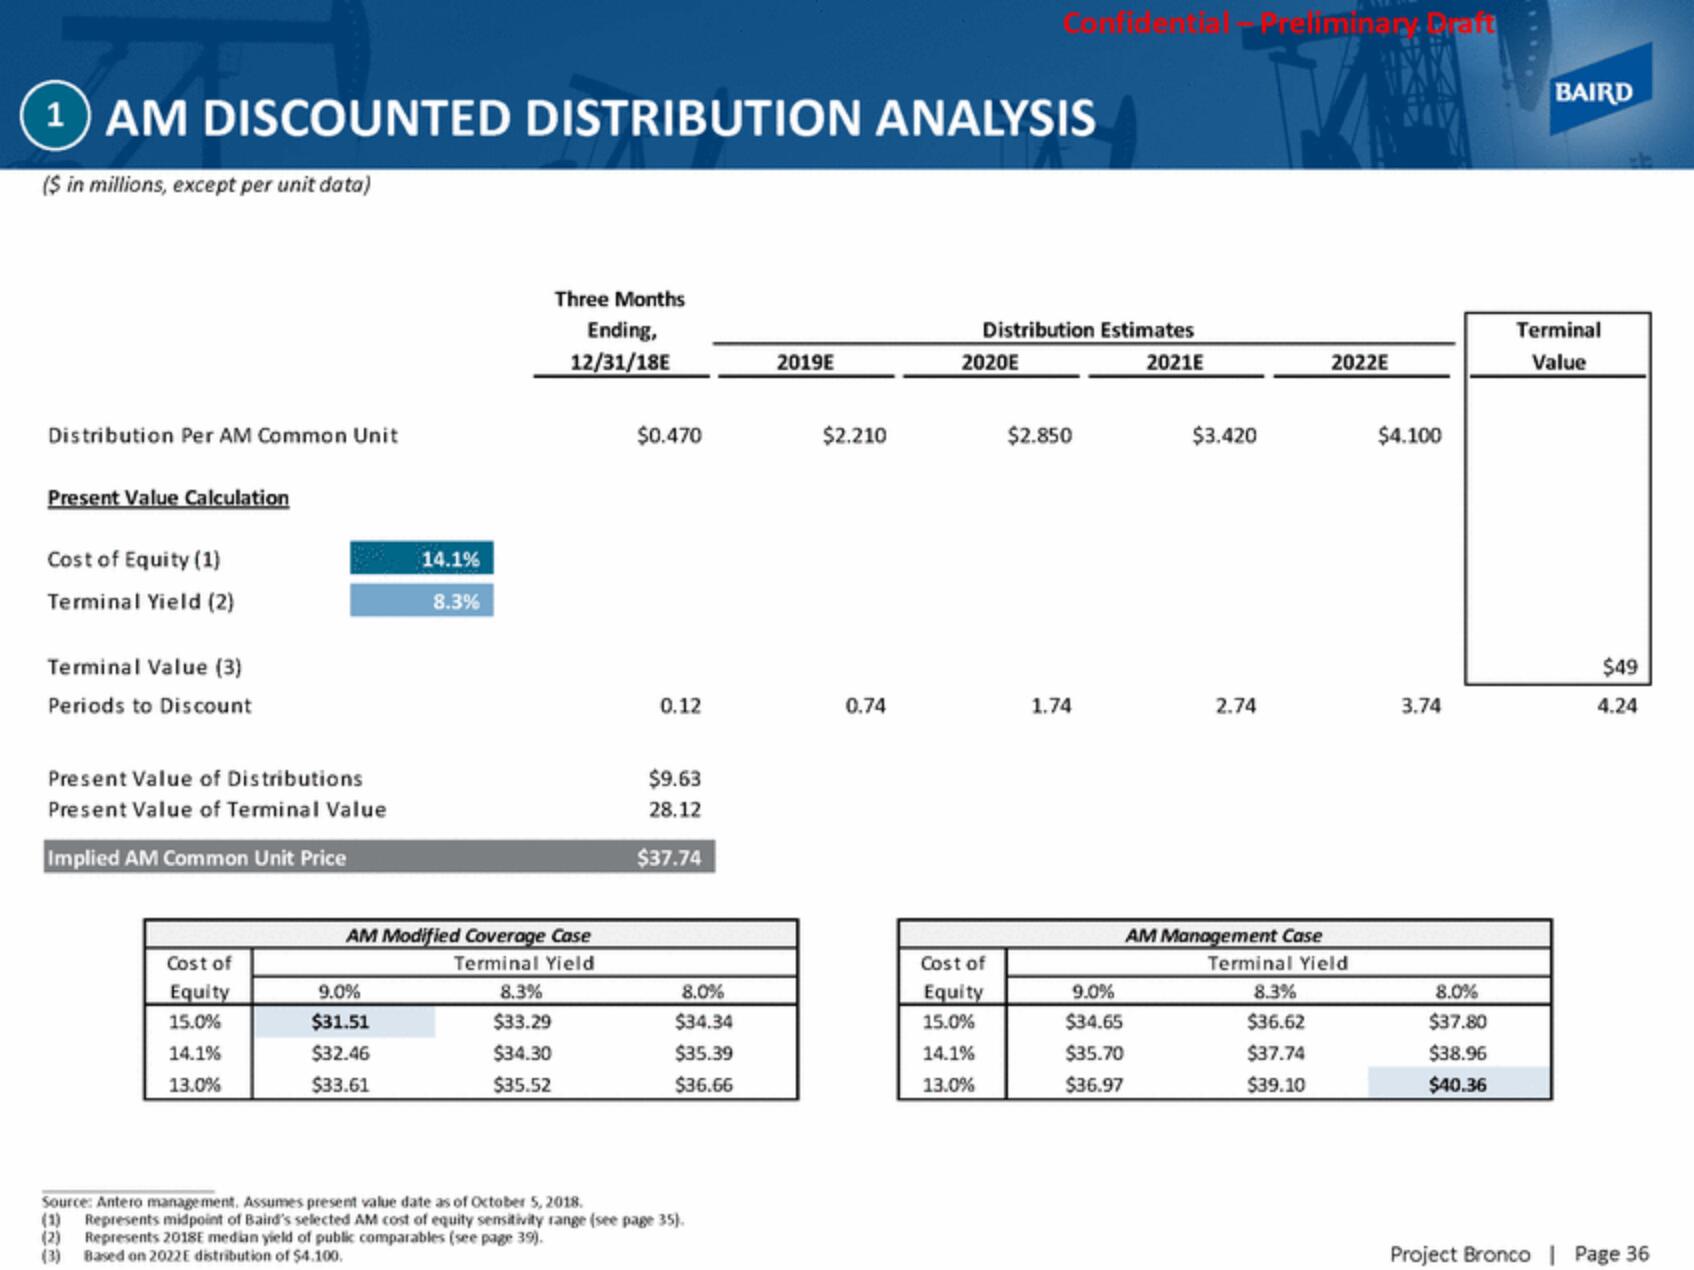
1 AM DISCOUNTED DISTRIBUTION ANALYSIS
($ in millions, except per unit data)
Distribution Per AM Common Unit
Present Value Calculation
Cost of Equity (1)
Terminal Yield (2)
Terminal Value (3)
Periods to Discount
Present Value of Distributions
Present Value of Terminal Value
Implied AM Common Unit Price
Cost of
Equity
15.0%
14.1%
13.0%
(2)
(3)
14.1%
8.3%
9.0%
$31.51
$32.46
$33.61
AM Modified Coverage Case
Terminal Yield
Three Months
Ending,
12/31/18E
8.3%
$33.29
$34.30
$35.52
$0.470
0.12
$9.63
28.12
$37.74
8.0%
$34.34
$35.39
$36.66
Source: Antero management. Assumes present value date as of October 5, 2018.
(1) Represents midpoint of Baird's selected AM cost of equity sensitivity range (see page 35).
Represents 2018E median yield of public comparables (see page 39).
Based on 2022E distribution of $4.100.
2019E
$2.210
0.74
Distribution Estimates
2021E
2020E
Cost of
Equity
15.0%
14.1%
13.0%
$2.850
1.74
9.0%
$34.65
$35.70
$36.97
Trellminan. Draft
$3.420
2.74
2022E
AM Management Case
Terminal Yield
8.3%
$36.62
$37.74
$39.10
$4.100
3.74
8.0%
$37.80
$38.96
$40.36
BAIRD
Terminal
Value
$49
4.24
Project Bronco | Page 36View entire presentation