Bank of America Investment Banking Pitch Book
Valuation Supporting Details
Pioneer Base Case vs. Wall Street Projections
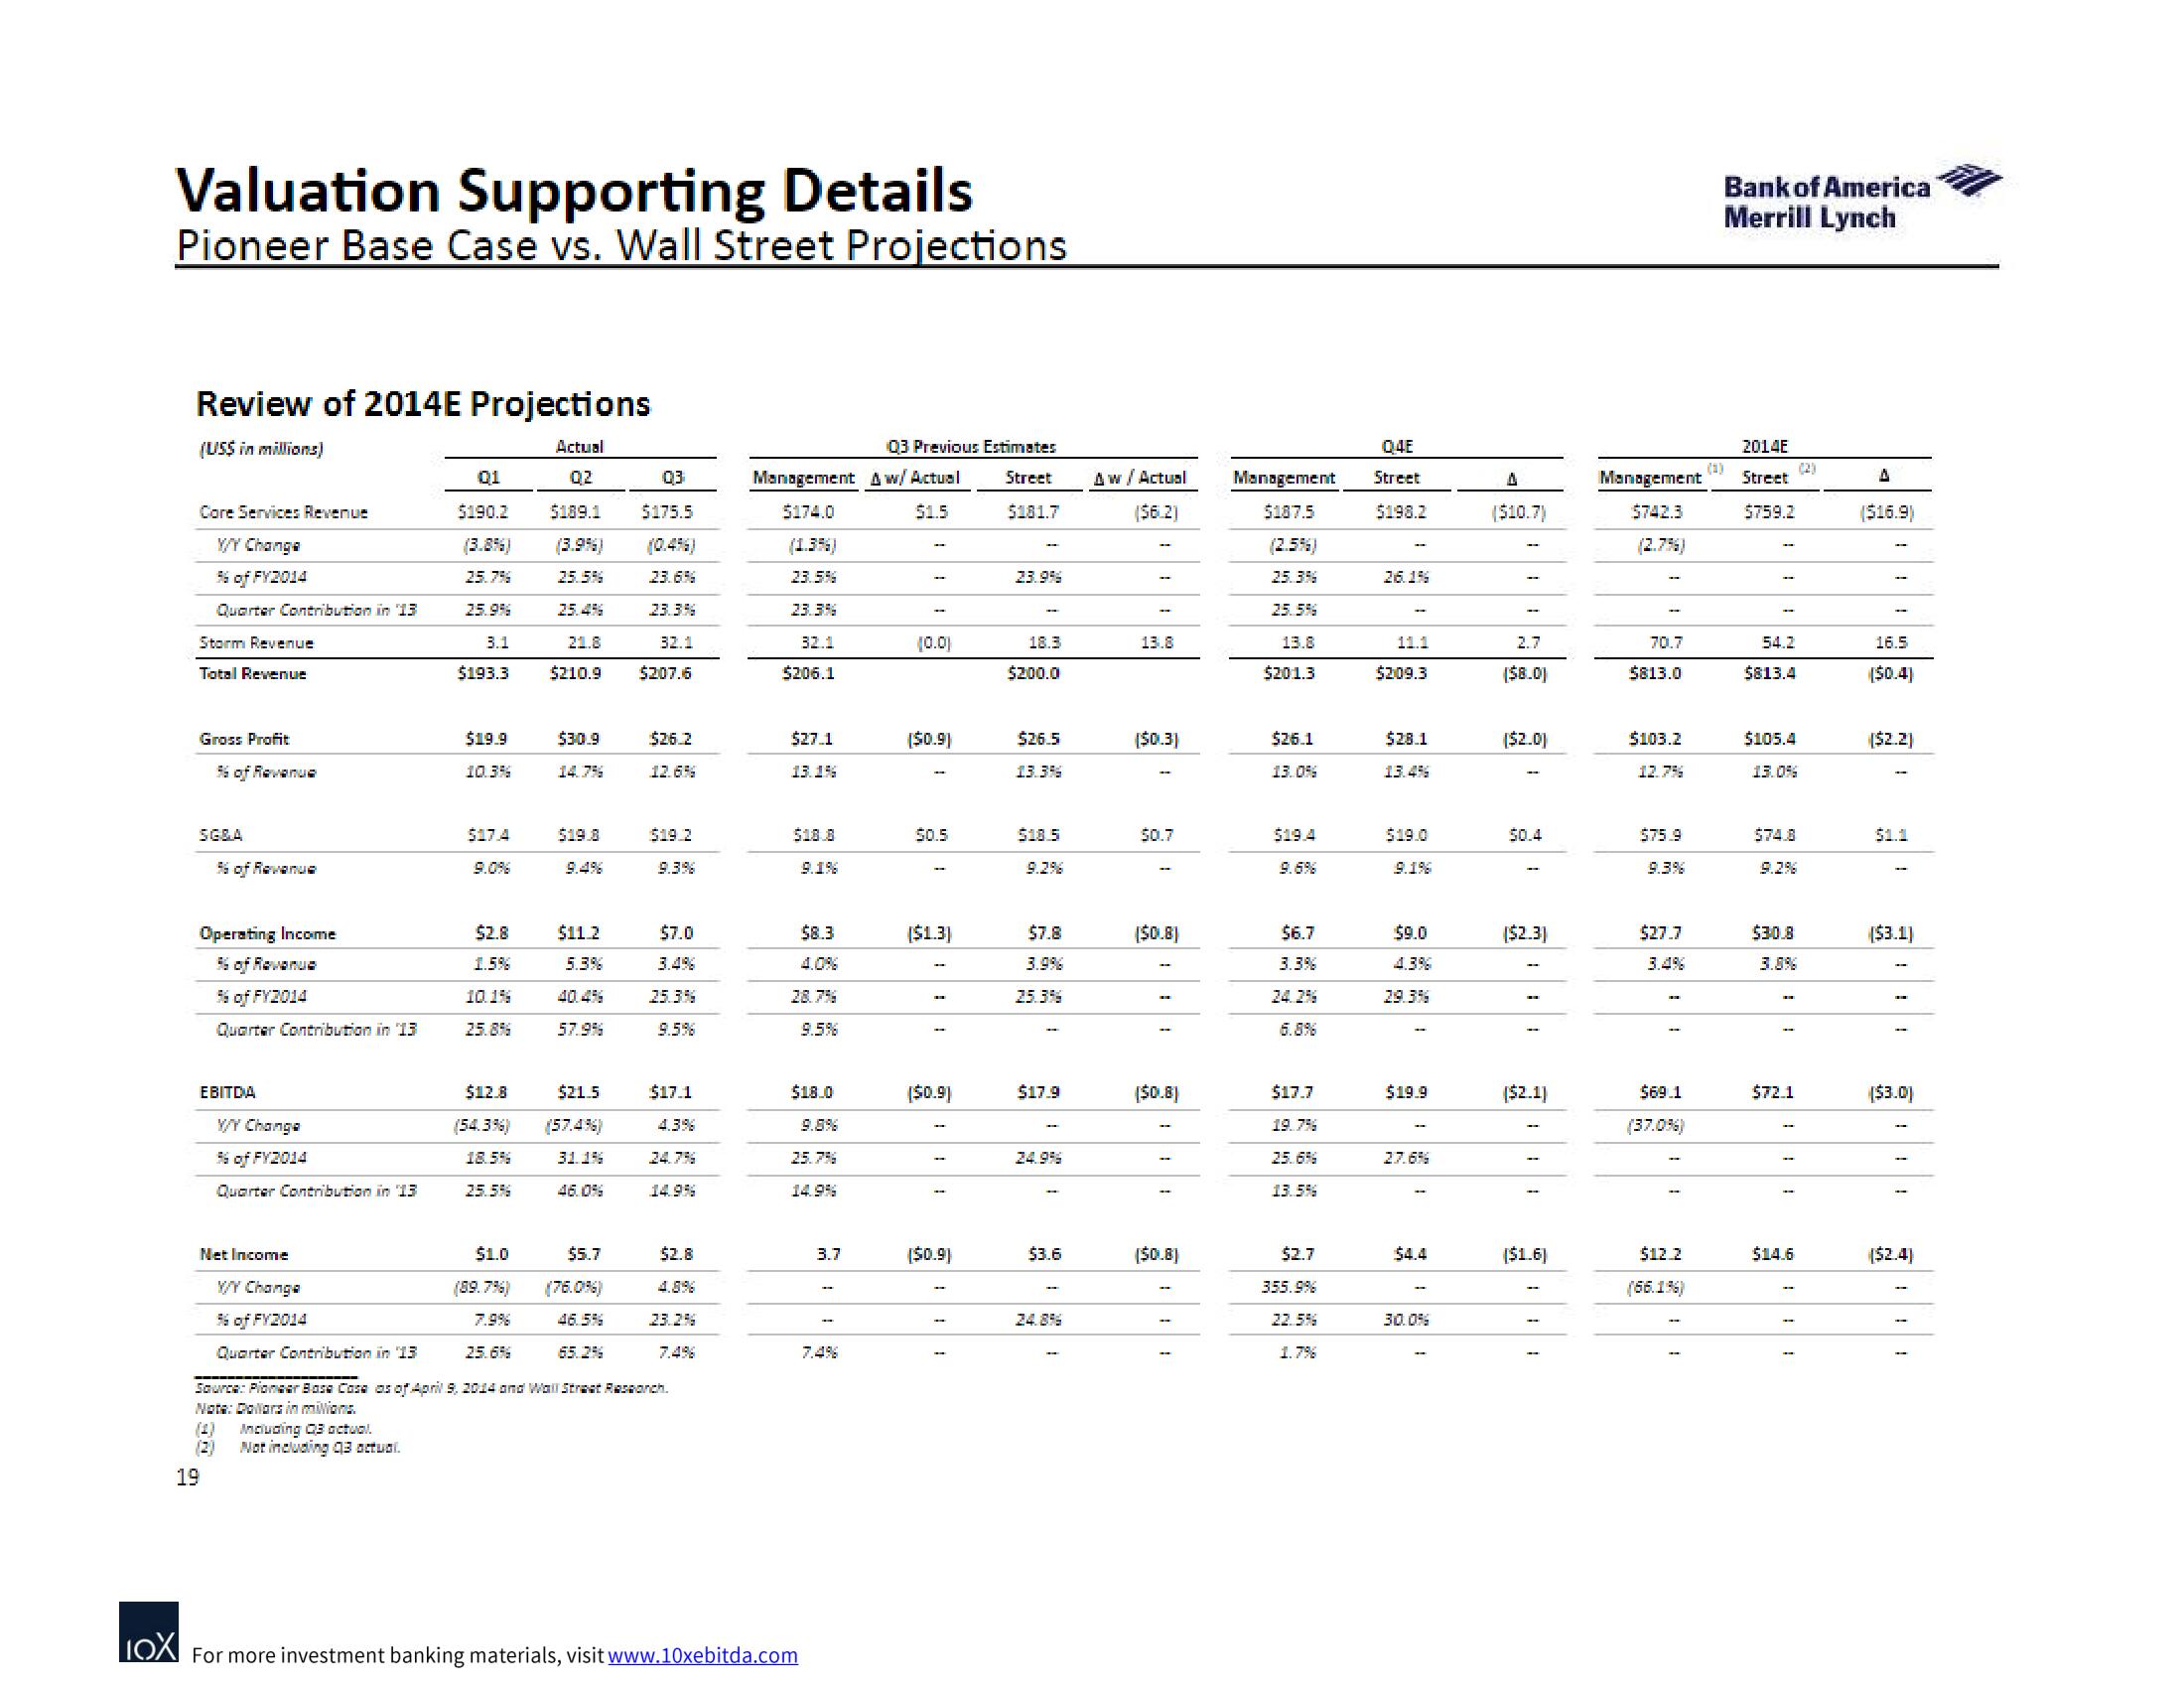
Review of 2014E Projections
(US$ in millions)
Actual
02
$189.1
Core Services Revenue
X/Y Change
% of FY2014
Quarter Contribution in 13
Storm Revenue
Total Revenue
Gross Profit
56 of Revenue
SG&A
19
% of Revenue
Operating Income
96 of Revenue
% of FY2014
Quarter Contribution in 13
EBITDA
X/Y Change
% of FY2014
Quarter Contribution in 13
Net Income
X/Y Change
% of FY2014
Quarter Contribution in 13
(1) Including 03 actual.
01
$190.2
(3.8%)
25.7%
25.9%
3.1
Not including 03 actual.
$193.3
$19.9
10.3%
$17.4
$2.8
1.5%
10.1%
25.8%
$1.0
(89.7%)
(3.9%)
25.5%
25.4%
25.6%
$30.9
14.7%
32.1
$210.9 $207.6
$19.8
$12.8
$21.5
(54.3%) (57.4%)
18.5%
31.1%
25.5%
$11.2
5.3%
40.4%
57.9%
03
$175.5
$5.7
23.6%
23.3%
$26.2
12.6%
$19.2
$7.0
25.3%
9.5%
$17.1
46.5%
65.2%
Source: Pioneer Boasa Cosa as of April 9, 2014 and Wall Street Research.
Note: Dollars in milions.
4.3%
$2.8
23.2%
Management Aw/ Actual
5174.0
$1.5
(1.3%)
23.5%
23.3%
32.1
$206.1
$27.1
13.1%
$18.8
9.1%
$8.3
28.7%
9.5%
$18.0
LOX For more investment banking materials, visit www.10xebitda.com
9.8%
25.7%
14.9%
03 Previous Estimates
Street
$181.7
3.7
[$0.9)
$0.5
1
($1.3)
m
[$0.9)
($0.9)
23.9%
18.3
$200.0
$26.5
13.3%
$18.5
9.2%
$7.8
3.9%
25.3%
$17.9
$3.6
Aw/Actual
($6.2)
13.8
($0.3]
$0.7
($0.8)
[$0.8)
[$0.8)
Management
$187.5
25.3%
25.5%
13.8
$201.3
$26.1
13.0%
$19.4
$6.7
$17.7
19.7%
25.6%
13.5%
$2.7
355.9%
22.5%
1.7%
Q4E
Street
$198.2
26.1%
11.1
$209.3
$28.1
13.4%
$19.0
9.1%
$9.0
4.3%
29.3%
$19.9
30.0%
A
($10.7)
2.7
($8.0)
[$2.0)
50.4
[$2.3)
($2.1)
($1.6)
Management
$742.3
-
70.7
5813.0
$103.2
12.7%
$75.9
$27.7
$69.1
(37.0%)
$12.2
(66.1%)
Bank of America
Merrill Lynch
2014E
Street
$759.2
54.2
$813.4
$105.4
13.0%
$74.8
$3.0.8
$72.1
$14.6
(2)
A
($16.9)
16.5
[$0.4)
[$2.2]
($3.1)
[$3.0)
($2.4)View entire presentation