Avantor Results Presentation Deck
10
M&A detail
(Dollars in millions)
Masterflex
Ritter
RIM Bio
Net sales
Masterflex
Acq. Date
01 Nov 2021
12 June 2021
01 June 2021
Ritter
RIM Bio
Total M&A Contribution
Navantor™
M&A (inorganic)
Organic
1Q22
Jan Feb
M&A
impact
(inorganic)
$68.5
$46.7
$2.1
$117.3
Mar
1Q22
10Q filing³
$68.5
$46.7
$115.2
2Q22
3Q22
Apr May Jun Jul Aug Sep Oct
Earnings
pres.c
$69
$47
$2
$118
M&A
impact
(inorganic)
$64.0
$26.2
$0.6
$90.8
2Q22
В
10Q filing B
$63.7
$33.4
$97.1
Earnings
pres.c
$67
$33
$2
$102
4Q22
Nov
Dec
$46.5
3Q22
M&A
impact
(inorganic) 10Q filing B
$46.5
$46.5
$39.6
$86.1
Earnings
с
pres.
$48
$40
$3
$91
M&A
impact
(inorganic)
$193.1
$72.9
$2.7
$268.7
M&A
impact
(inorganic)
$14.1
$14.1
FY2022
10K filing B
$227.3
$151.1
$378.4
4Q22
4Q implied
(10K filing)
$48.6
$31.4
$80.0
Earnings
pres.
$232
$151
$10
$393
Earnings
pres.
$49
$31
$3
$83
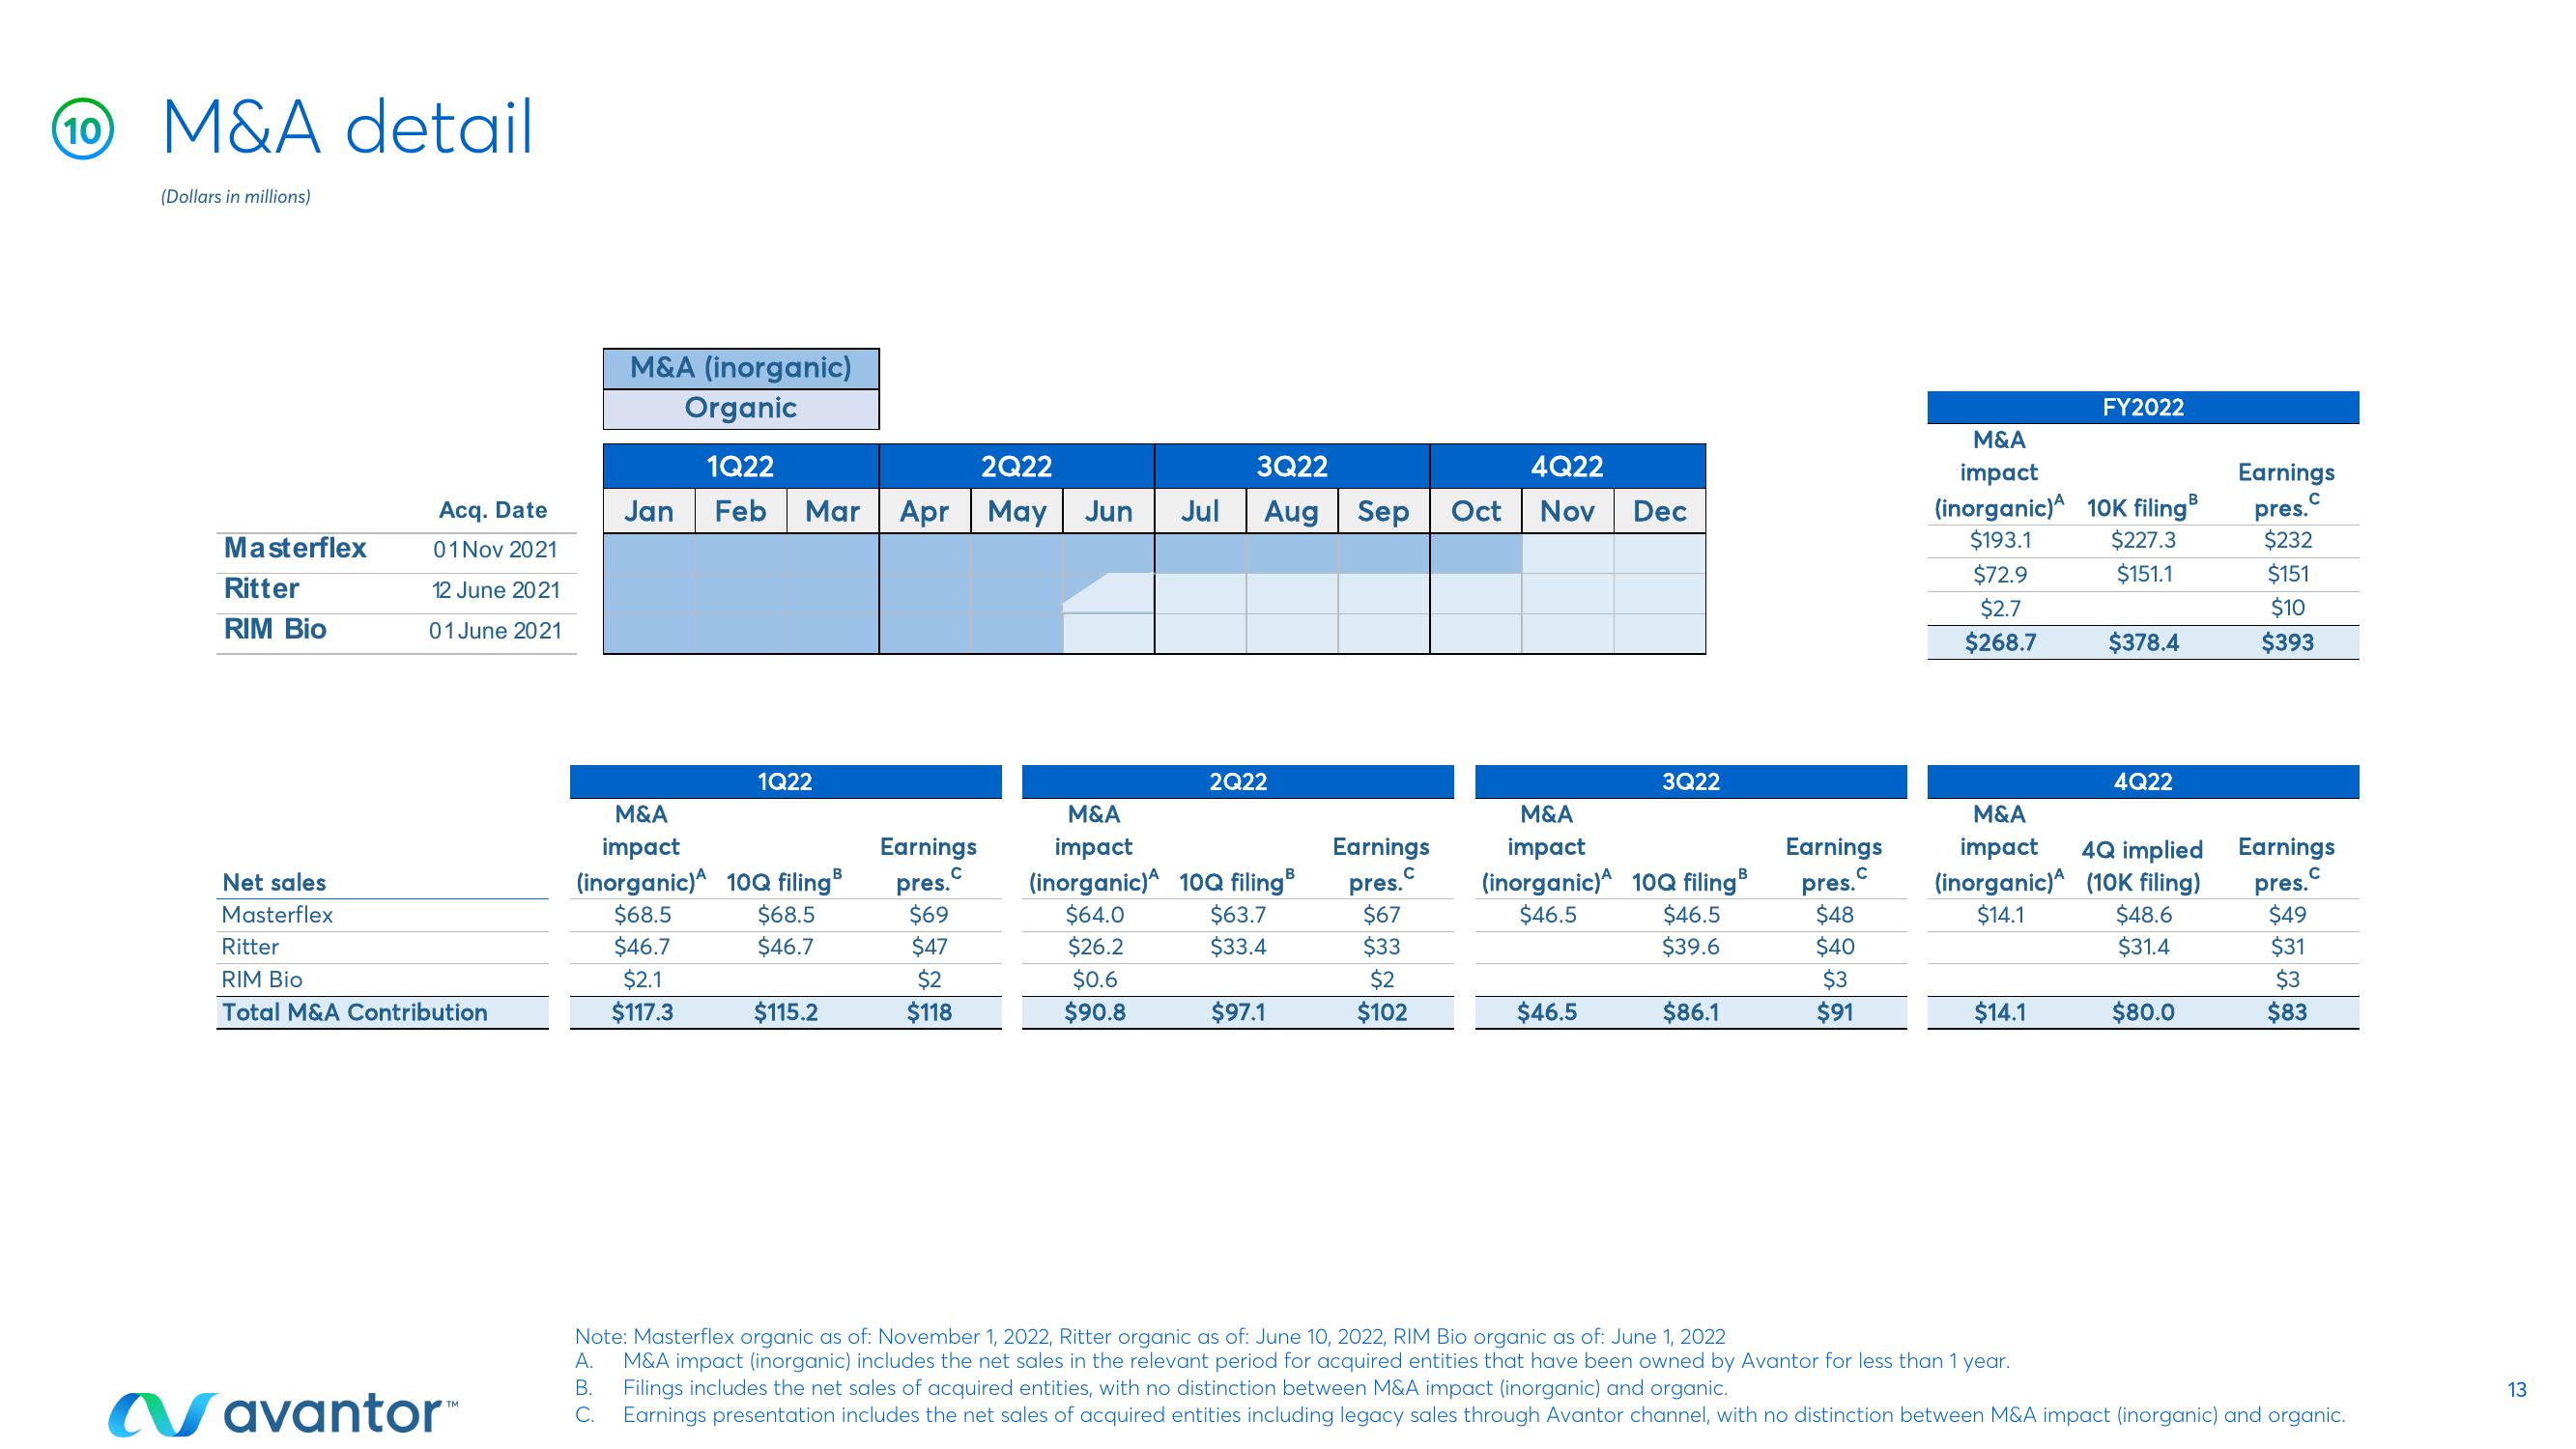
Note: Masterflex organic as of: November 1, 2022, Ritter organic as of: June 10, 2022, RIM Bio organic as of: June 1, 2022
A.
M&A impact (inorganic) includes the net sales in the relevant period for acquired entities that have been owned by Avantor for less than 1 year.
Filings includes the net sales of acquired entities, with no distinction between M&A impact (inorganic) and organic.
B.
C. Earnings presentation includes the net sales of acquired entities including legacy sales through Avantor channel, with no distinction between M&A impact (inorganic) and organic.
13View entire presentation