MP Materials Results Presentation Deck
11
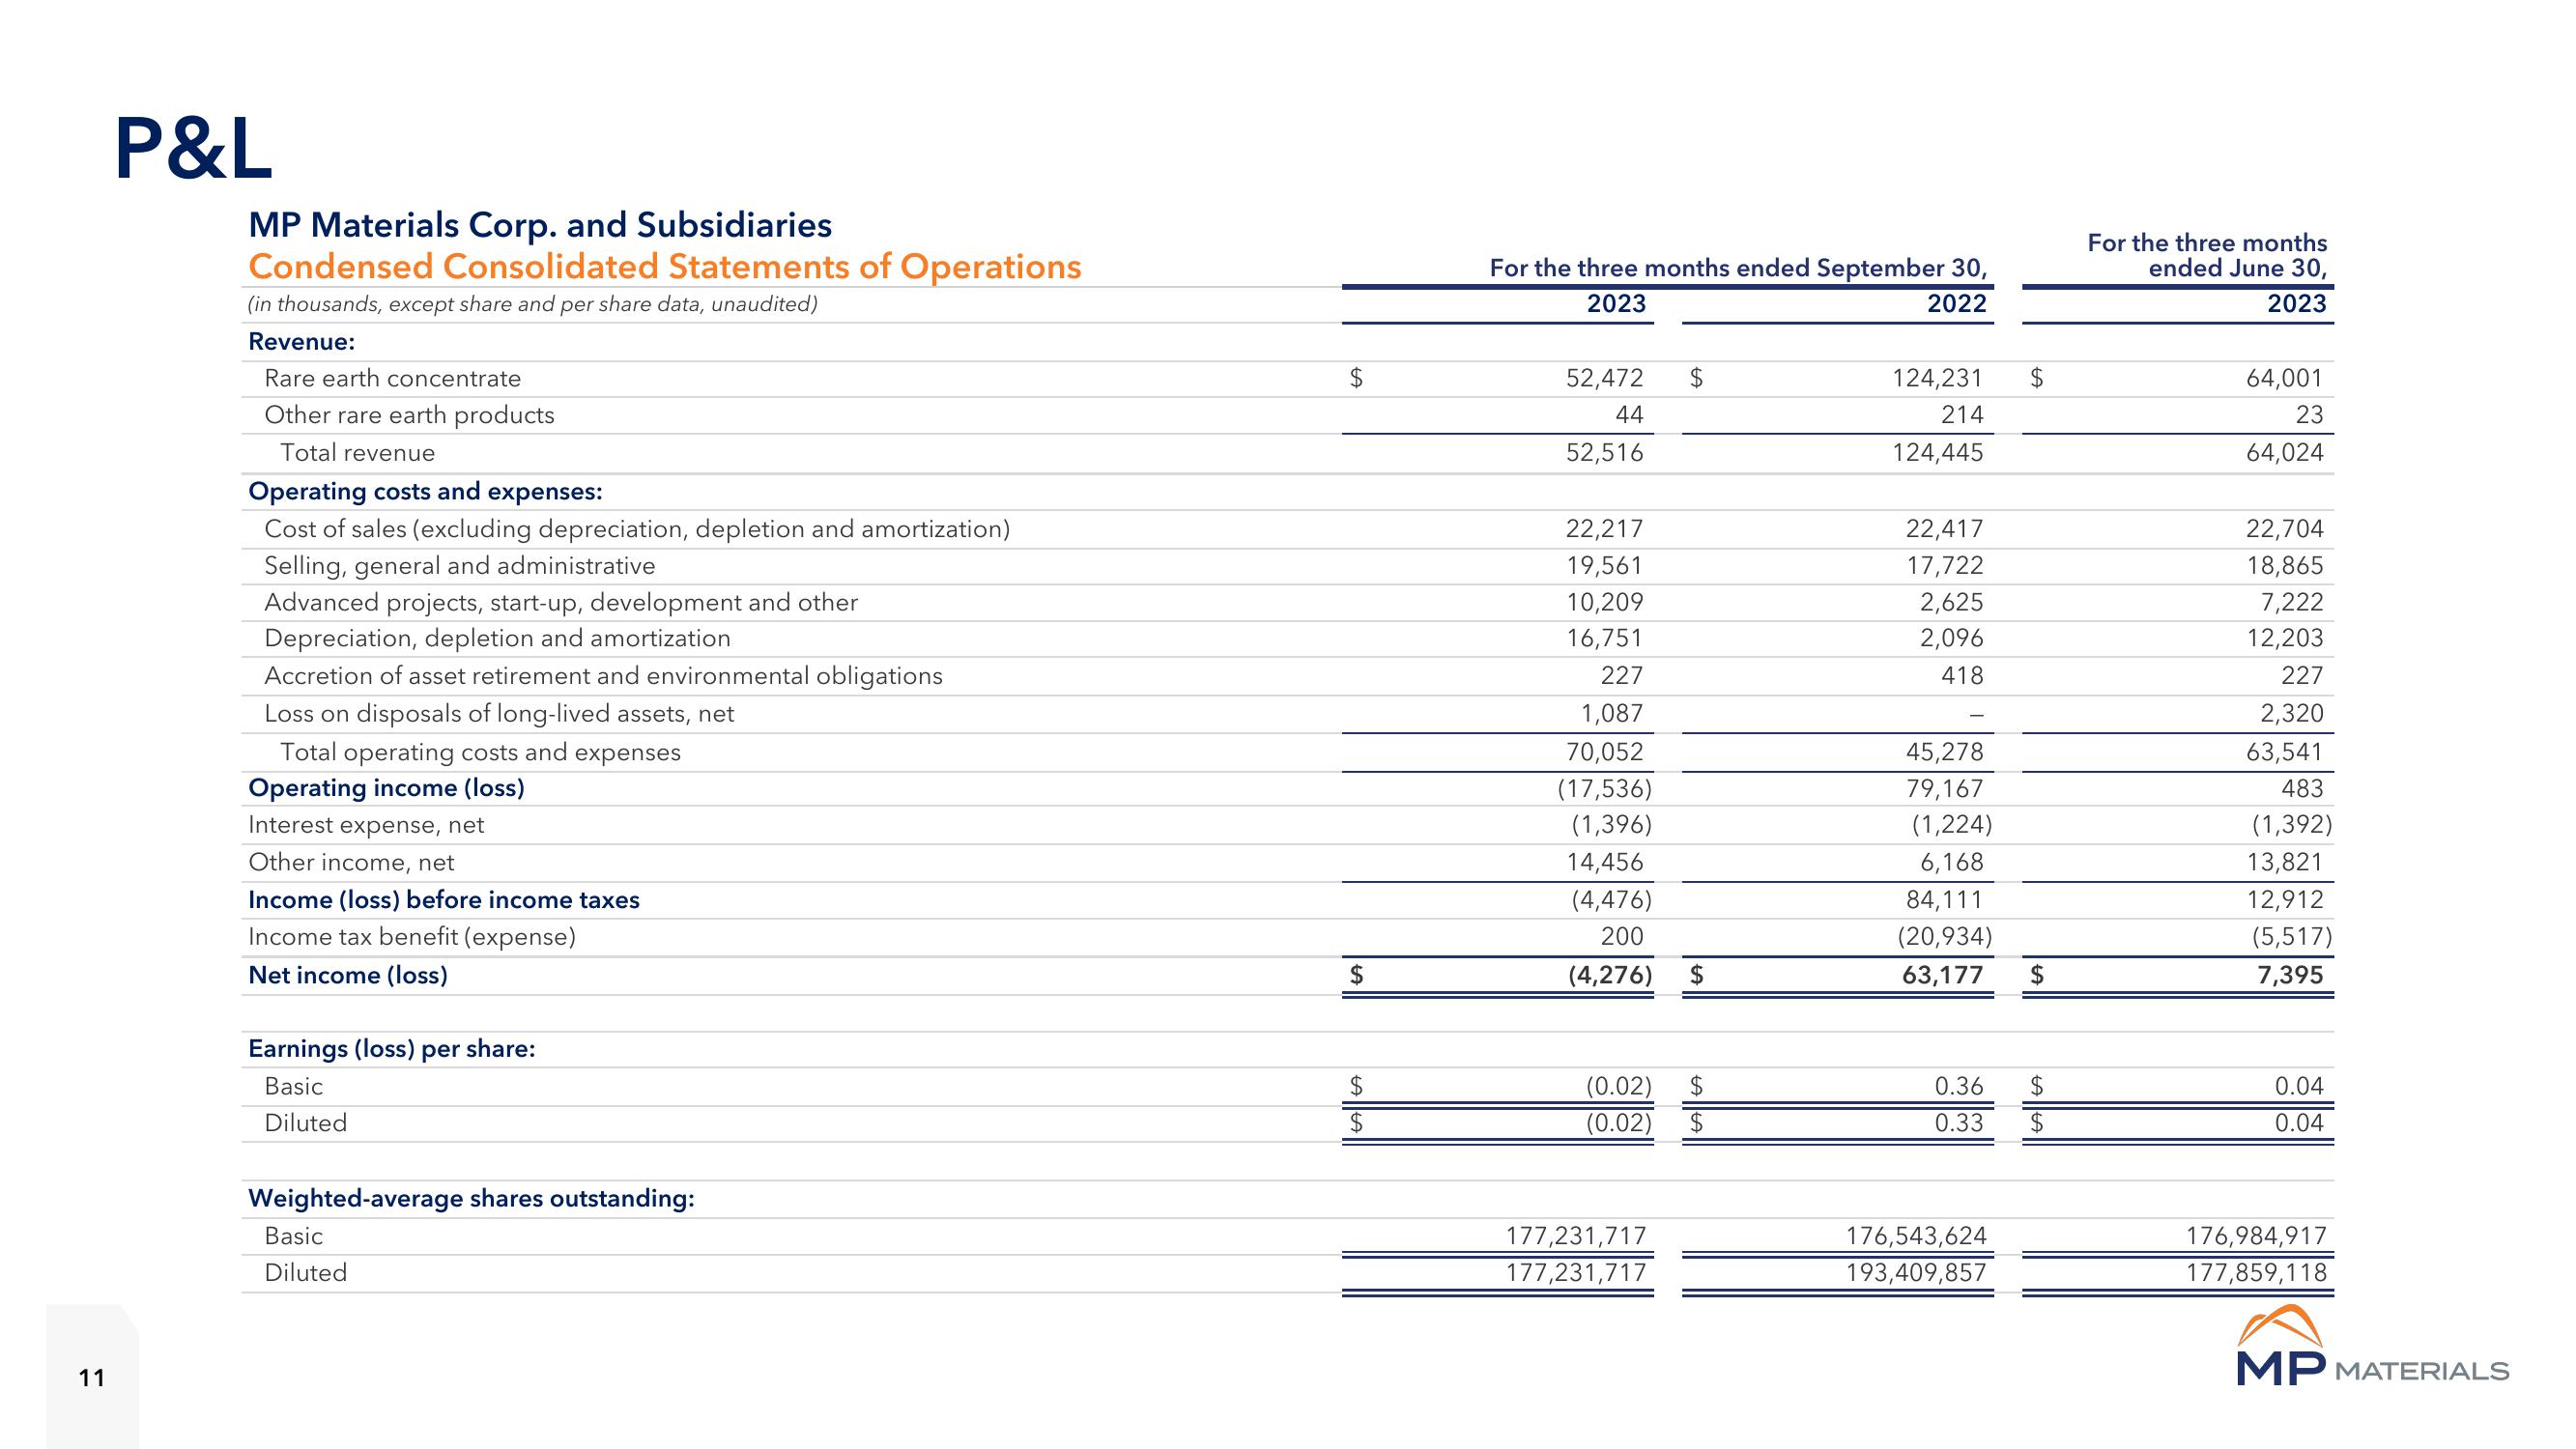
P&L
MP Materials Corp. and Subsidiaries
Condensed Consolidated Statements of Operations
(in thousands, except share and per share data, unaudited)
Revenue:
Rare earth concentrate
Other rare earth products
Total revenue
Operating costs and expenses:
Cost of sales (excluding depreciation, depletion and amortization)
Selling, general and administrative
Advanced projects, start-up, development and other
Depreciation, depletion and amortization
Accretion of asset retirement and environmental obligations
Loss on disposals of long-lived assets, net
Total operating costs and expenses
Operating income (loss)
Interest expense, net
Other income, net
Income (loss) before income taxes
Income tax benefit (expense)
Net income (loss)
Earnings (loss) per share:
Basic
Diluted
Weighted-average shares outstanding:
Basic
Diluted
$
$
$
For the three months ended September 30,
2023
2022
52,472
44
52,516
22,217
19,561
10,209
16,751
227
1,087
70,052
(17,536)
(1,396)
14,456
(4,476)
200
(4,276) $
(0.02)
(0.02)
$
177,231,717
177,231,717
$
$
124,231
214
124,445
22,417
17,722
2,625
2,096
418
$
45,278
79,167
(1,224)
6,168
84,111
(20,934)
63,177 $
0.36 $
0.33
$
176,543,624
193,409,857
For the three months
ended June 30,
2023
64,001
23
64,024
22,704
18,865
7,222
12,203
227
2,320
63,541
483
(1,392)
13,821
12,912
(5,517)
7,395
0.04
0.04
176,984,917
177,859,118
MP MATERIALSView entire presentation