Crowdstrike Investor Day Presentation Deck
GAAP cost of revenue
Less:
Stock based compensation expense
Amortization of acquired intangible assets
Non-GAAP cost of revenue
GAAP subscription gross profit
Add:
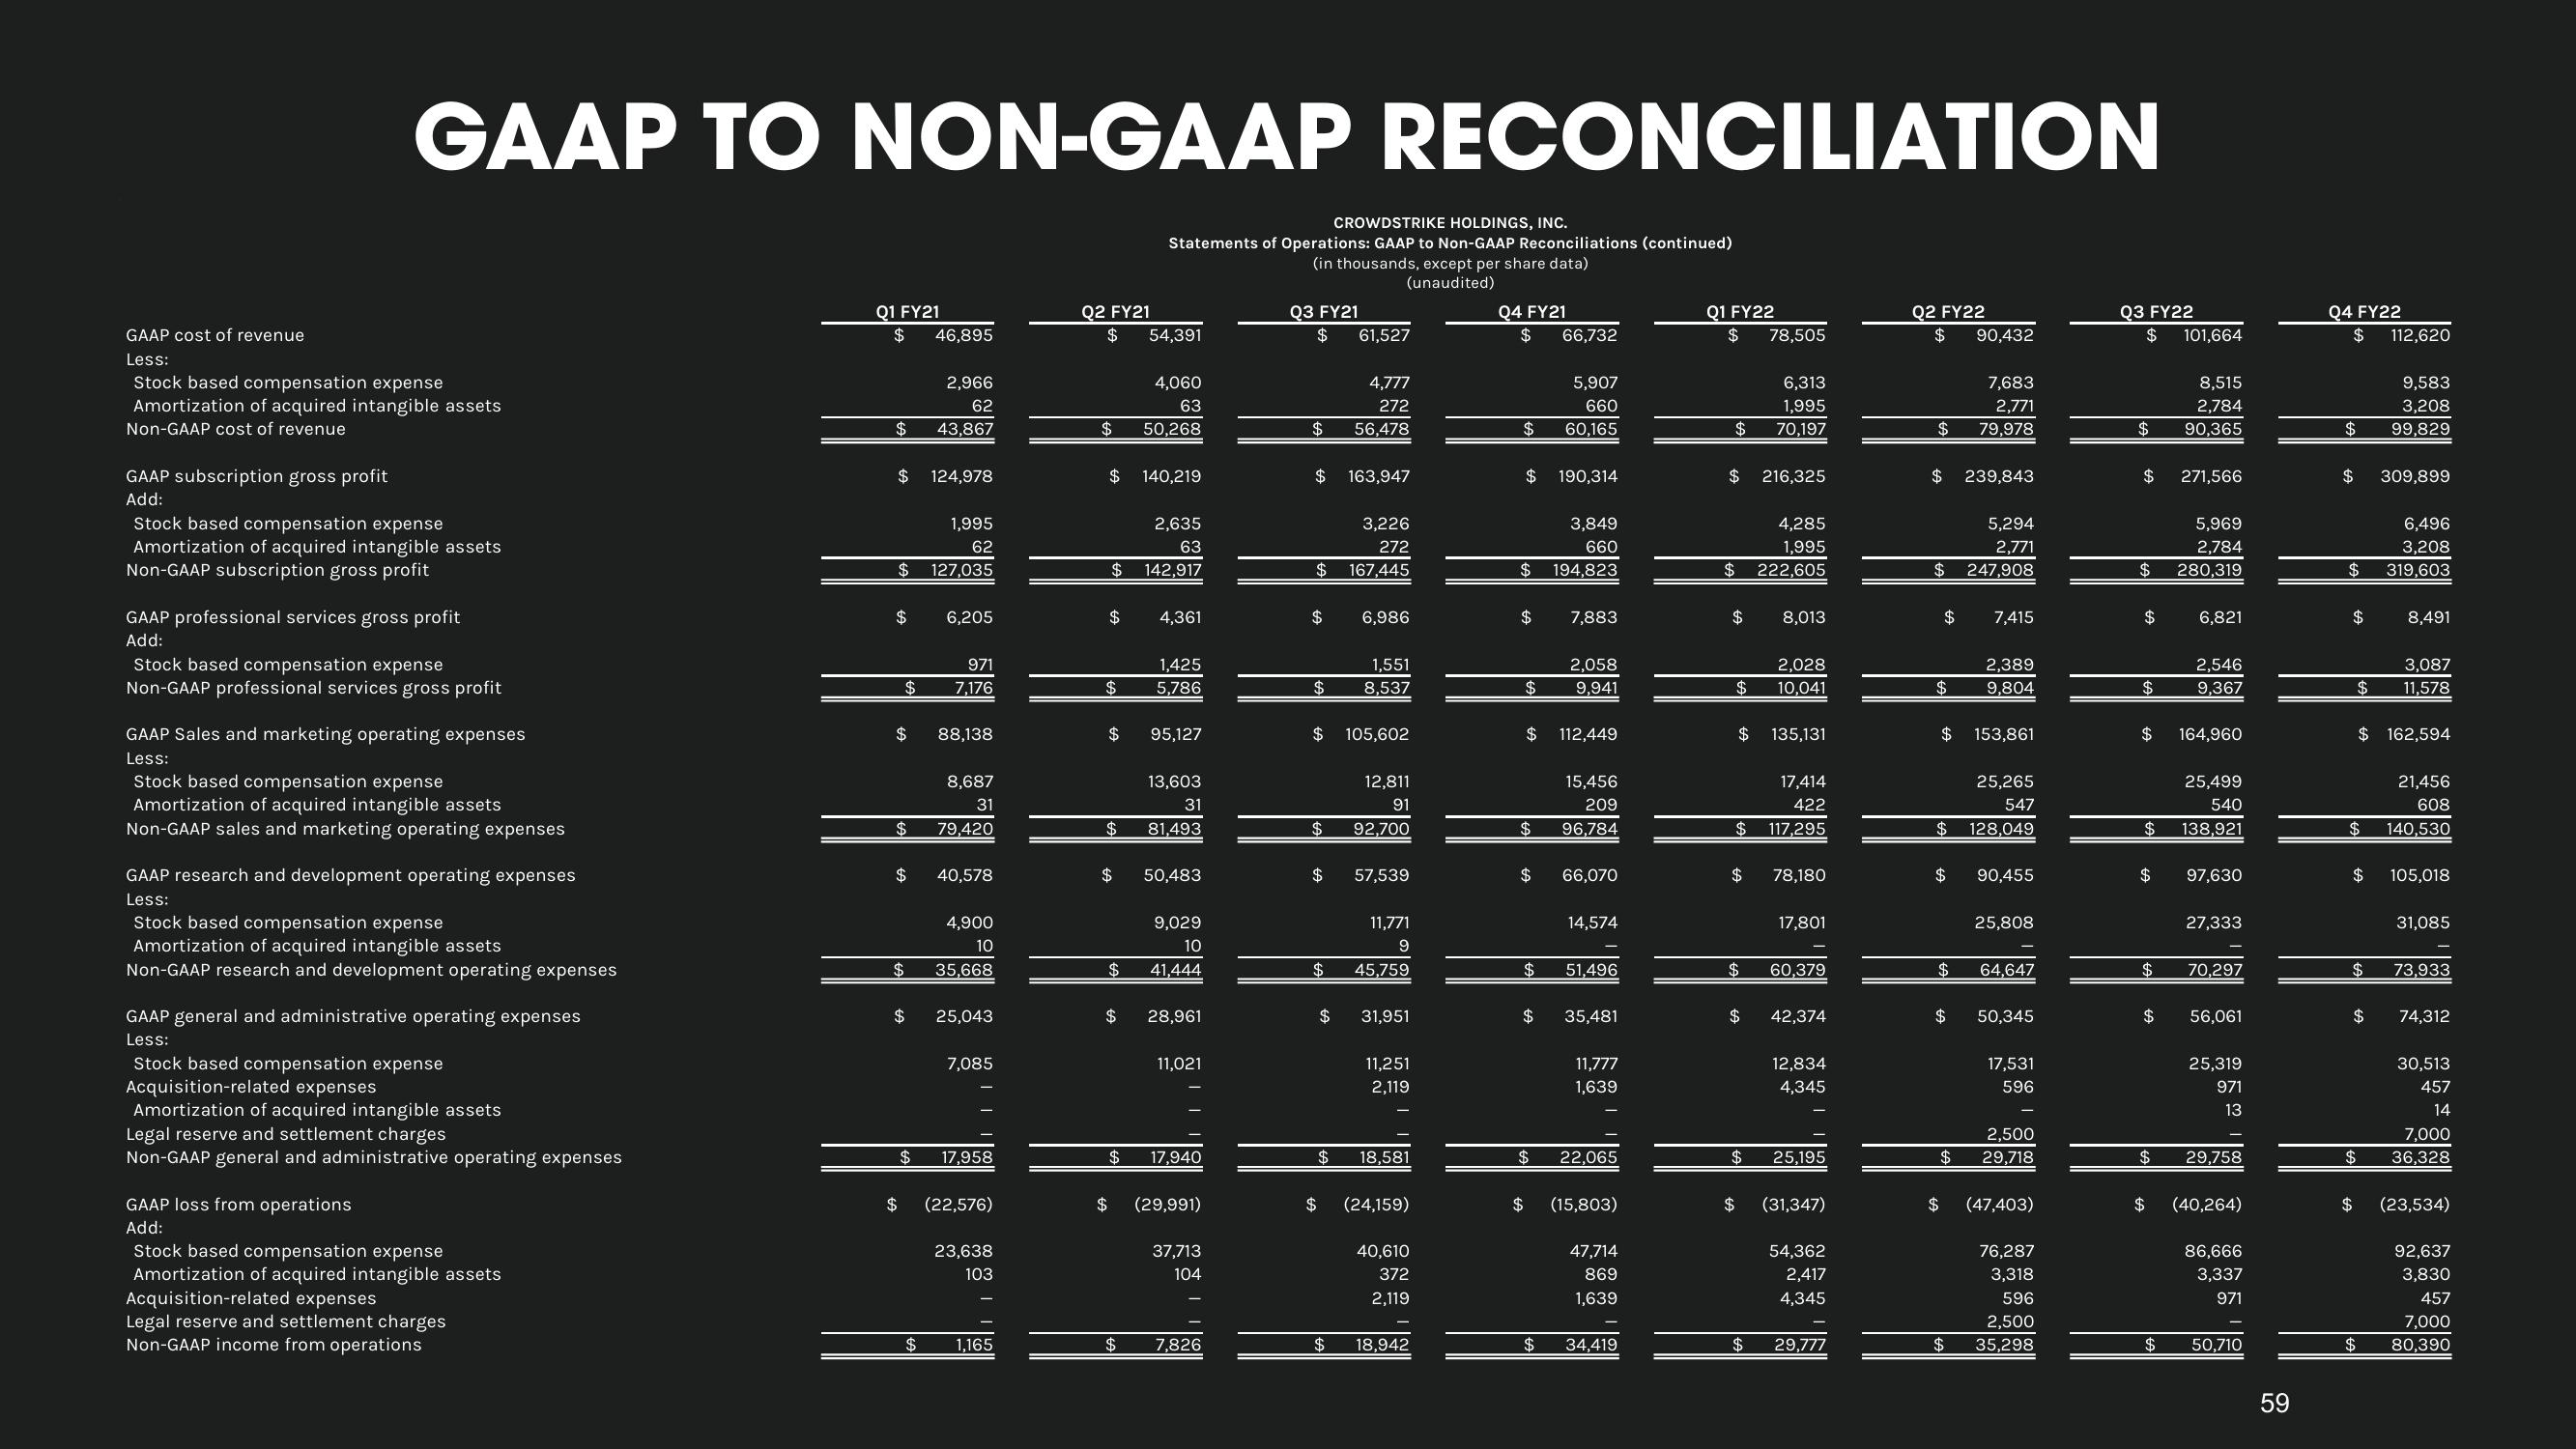
GAAP TO NON-GAAP RECONCILIATION
CROWDSTRIKE HOLDINGS, INC.
Statements of Operations: GAAP to Non-GAAP Reconciliations (continued)
(in thousands, except per share data)
(unaudited)
Stock based compensation expense
Amortization of acquired intangible assets
Non-GAAP subscription gross profit
GAAP professional services gross profit
Add:
Stock based compensation expense
Non-GAAP professional services gross profit
GAAP Sales and marketing operating expenses
Less:
Stock based compensation expense
Amortization of acquired intangible assets
Non-GAAP sales and marketing operating expenses
GAAP research and development operating expenses
Less:
Stock based compensation expense
Amortization of acquired intangible assets
Non-GAAP research and development operating expenses
GAAP general and administrative operating expenses
Less:
Stock based compensation expense
Acquisition-related expenses
Amortization of acquired intangible assets
Legal reserve and settlement charges
Non-GAAP general and administrative operating expenses
GAAP loss from operations
Add:
Stock based compensation expense
Amortization of acquired intangible assets
Acquisition-related expenses
Legal reserve and settlement charges
Non-GAAP income from operations
Q1 FY21
$
$ 124,978
$
1,995
62
$ 127,035
$
$
$
$
$
$
46,895
2,966
62
43,867
$
$
6,205
971
7,176
88,138
8,687
31
79,420
$ 25,043
40,578
4,900
10
35,668
7,085
17,958
(22,576)
23,638
103
1,165
Q2 FY21
$
$
$
$
2,635
63
$ 142,917
$
FA
$ 4,361
$
$
$
54,391
$
4,060
63
50,268
140,219
$
1,425
5,786
95,127
13,603
31
81,493
50,483
9,029
10
41,444
28,961
11,021
$ 17,940
$ (29,991)
37,713
104
7,826
Q3 FY21
$
4,777
272
$ 56,478
$
$
$
$
$
$
$
$
$
$
61,527
$
163,947
3,226
272
167,445
6,986
1,551
8,537
105,602
12,811
91
92,700
57,539
11,771
9
45,759
31,951
11,251
2,119
18,581
$ (24,159)
40,610
372
2,119
18,942
Q4 FY21
$
5,907
660
$ 60,165
$
$
$
$
$
$
$
$
$
$
66,732
$ 112,449
$
190,314
3,849
660
194,823
7,883
2,058
9,941
15,456
209
96,784
66,070
14,574
51,496
35,481
11,777
1,639
22,065
(15,803)
47,714
869
1,639
34,419
Q1 FY22
$
$
$
$
$
4,285
1,995
$ 222,605
78,505
6,313
1,995
70,197
$
216,325
$ 135,131
$
8,013
17,414
422
$ 117,295
2,028
10,041
$ 78,180
$
17,801
$ 42,374
60,379
12,834
4,345
25,195
$ (31,347)
54,362
2,417
4,345
29,777
Q2 FY22
$
7,683
2,771
$ 79,978
$ 239,843
5,294
2,771
$ 247,908
$
$
$
90,432
$
$
$
25,265
547
$ 128,049
7,415
$
2,389
9,804
153,861
90,455
25,808
64,647
50,345
17,531
596
2,500
$ 29,718
(47,403)
76,287
3,318
596
2,500
35,298
Q3 FY22
$ 101,664
8,515
2,784
$ 90,365
$ 271,566
$
$
$
$
$
$
$
25,499
540
$ 138,921
$
$
5,969
2,784
280,319
$
6,821
2,546
9,367
164,960
97,630
27,333
70,297
56,061
25,319
971
13
29,758
(40,264)
86,666
3,337
971
50,710
59
Q4 FY22
$
$
$
$
6,496
3,208
$ 319,603
$
$
$
$
$
$
$
112,620
$
9,583
3,208
99,829
309,899
$ 162,594
8,491
3,087
11,578
21,456
608
140,530
105,018
31,085
73,933
74,312
30,513
457
14
7,000
36,328
(23,534)
92,637
3,830
457
7,000
80,390View entire presentation