Telia Company Results Presentation Deck
OPERATIONAL FREE CASH FLOW
16
4 12 1086
14
●
4
2
0
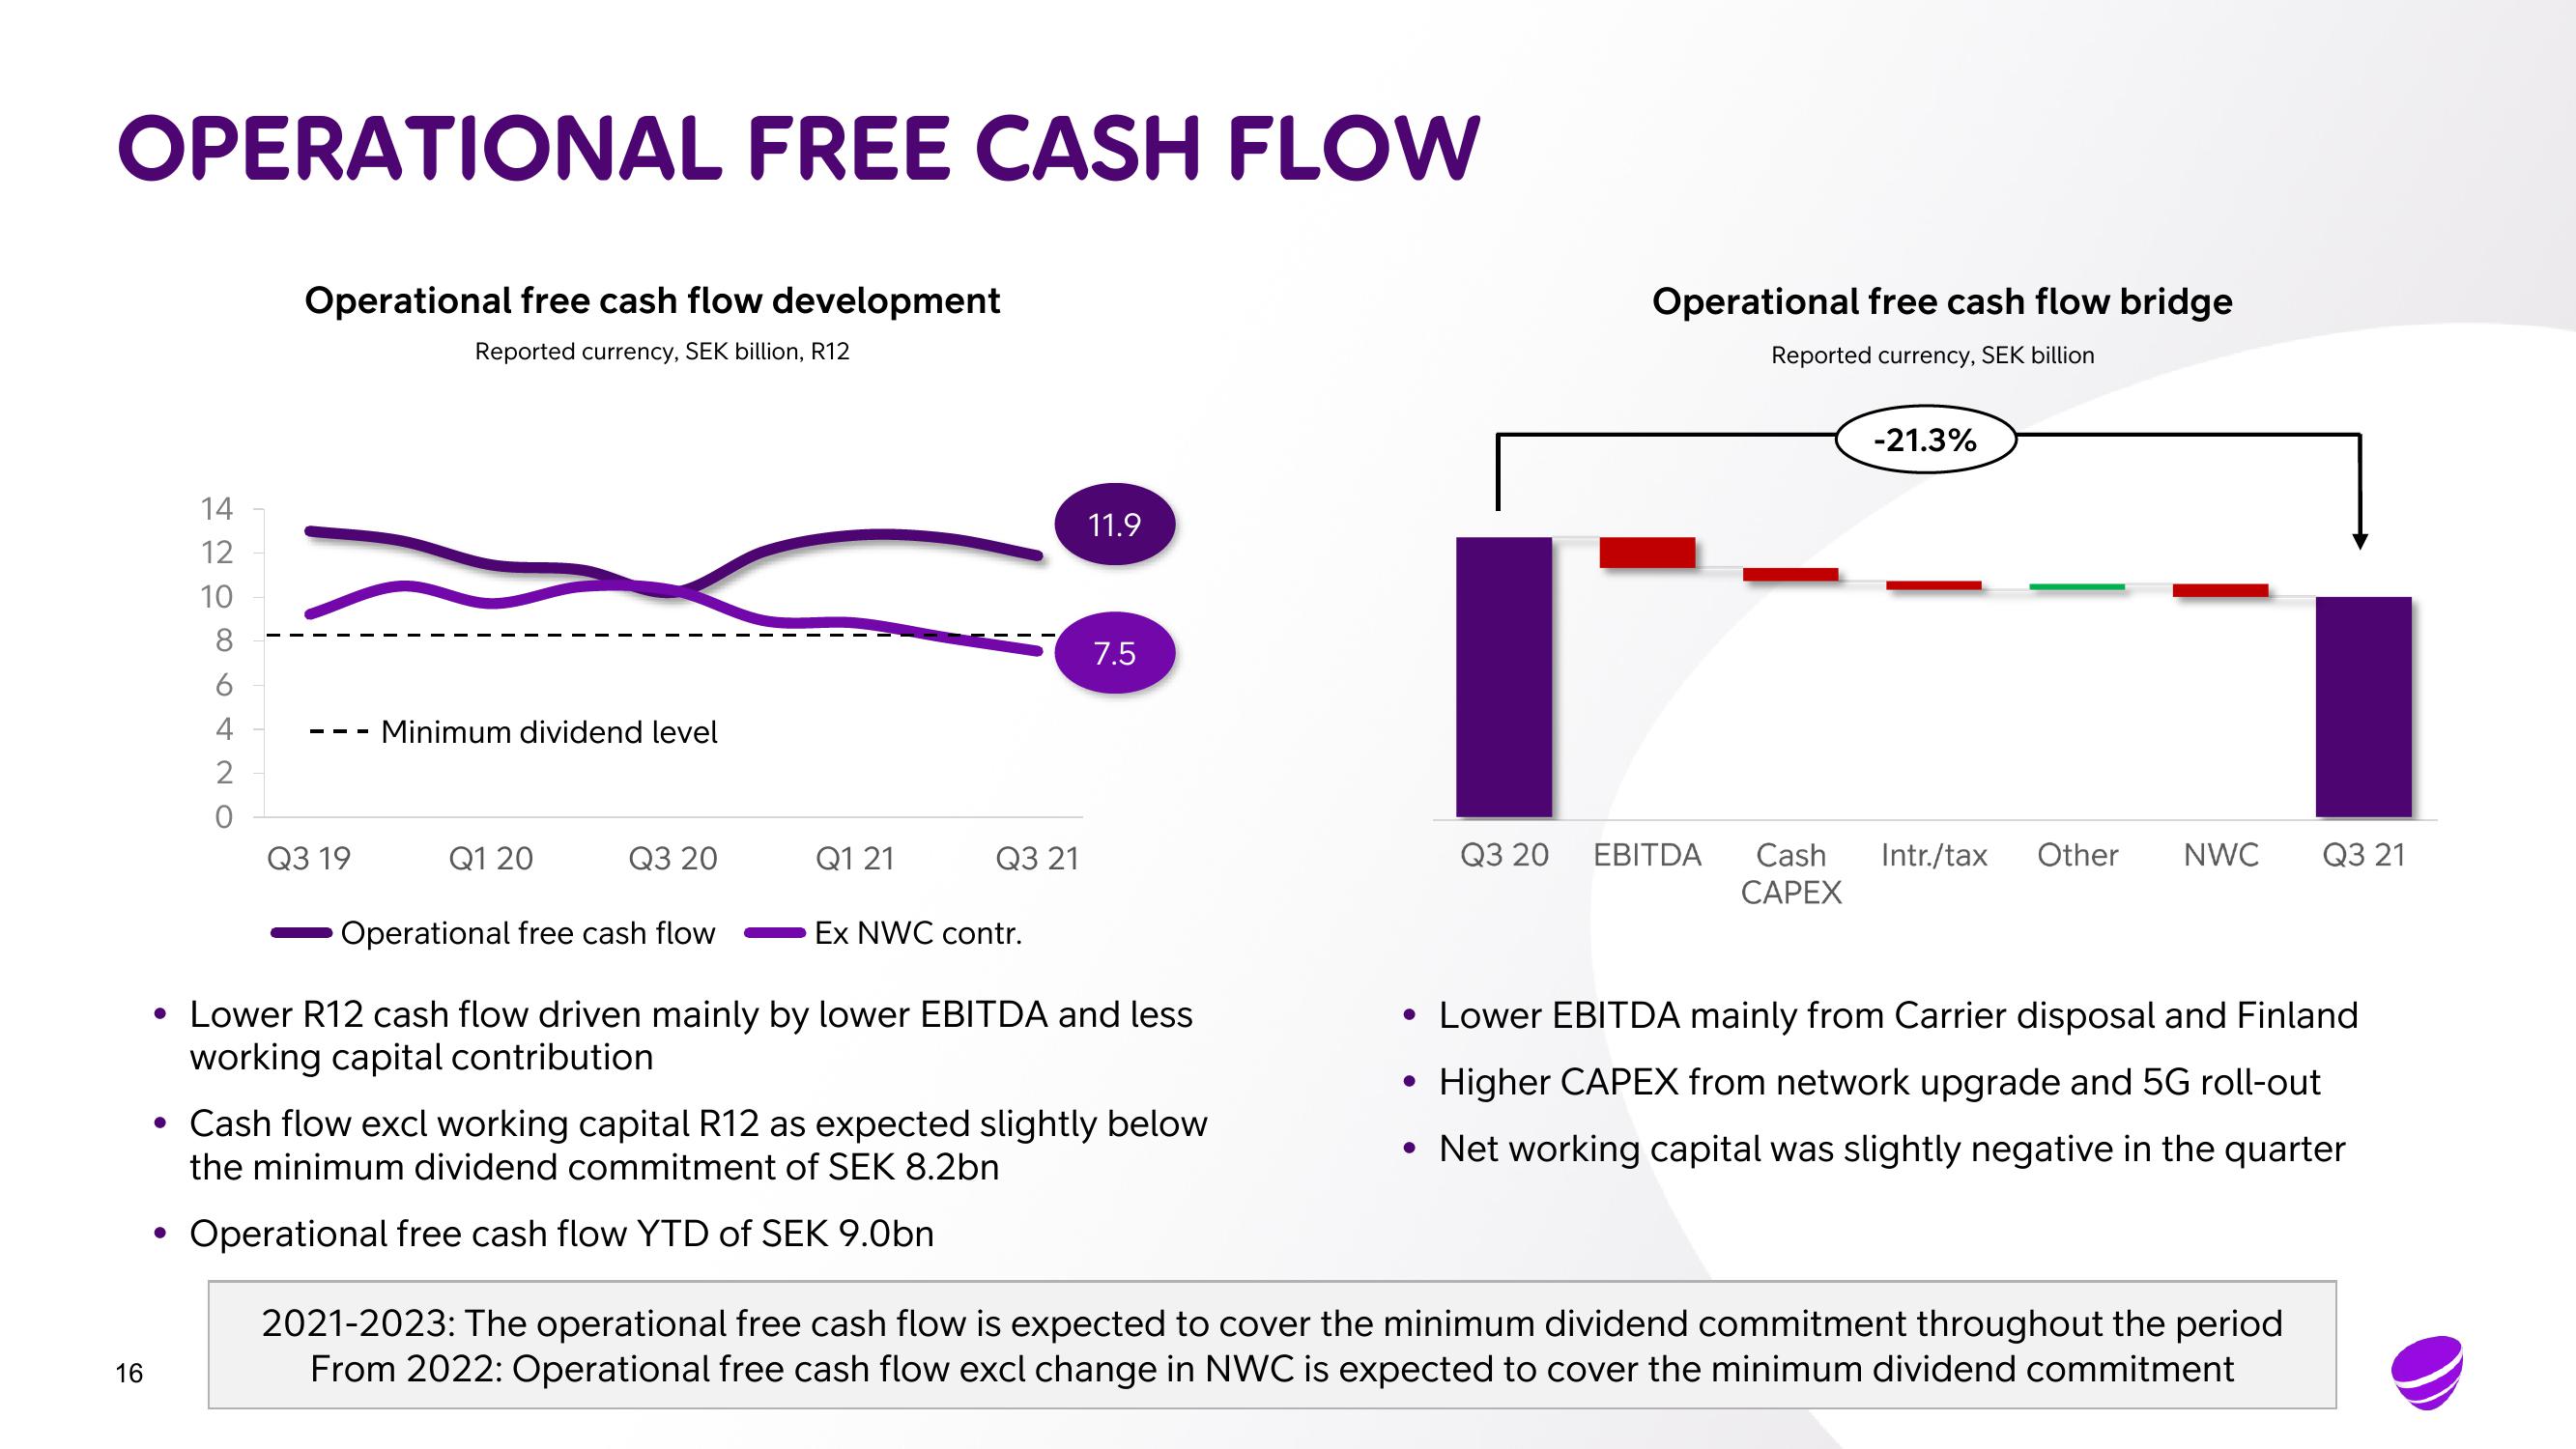
Operational free cash flow development
Reported currency, SEK billion, R12
Q3 19
Minimum dividend level
Q1 20
Q3 20
Q1 21
Q3 21
Ex NWC contr.
11.9
Operational free cash flow
• Lower R12 cash flow driven mainly by lower EBITDA and less
working capital contribution
7.5
• Cash flow excl working capital R12 as expected slightly below
the minimum dividend commitment of SEK 8.2bn
Operational free cash flow YTD of SEK 9.0bn
Operational free cash flow bridge
Reported currency, SEK billion
●
Q3 20 EBITDA
-21.3%
Cash Intr./tax Other NWC Q3 21
CAPEX
• Lower EBITDA mainly from Carrier disposal and Finland
Higher CAPEX from network upgrade and 5G roll-out
• Net working capital was slightly negative in the quarter
2021-2023: The operational free cash flow is expected to cover the minimum dividend commitment throughout the period
From 2022: Operational free cash flow excl change in NWC is expected to cover the minimum dividend commitmentView entire presentation