GMS Results Presentation Deck
Solid Levels of Profitability
Gross Profit
& Gross Margin
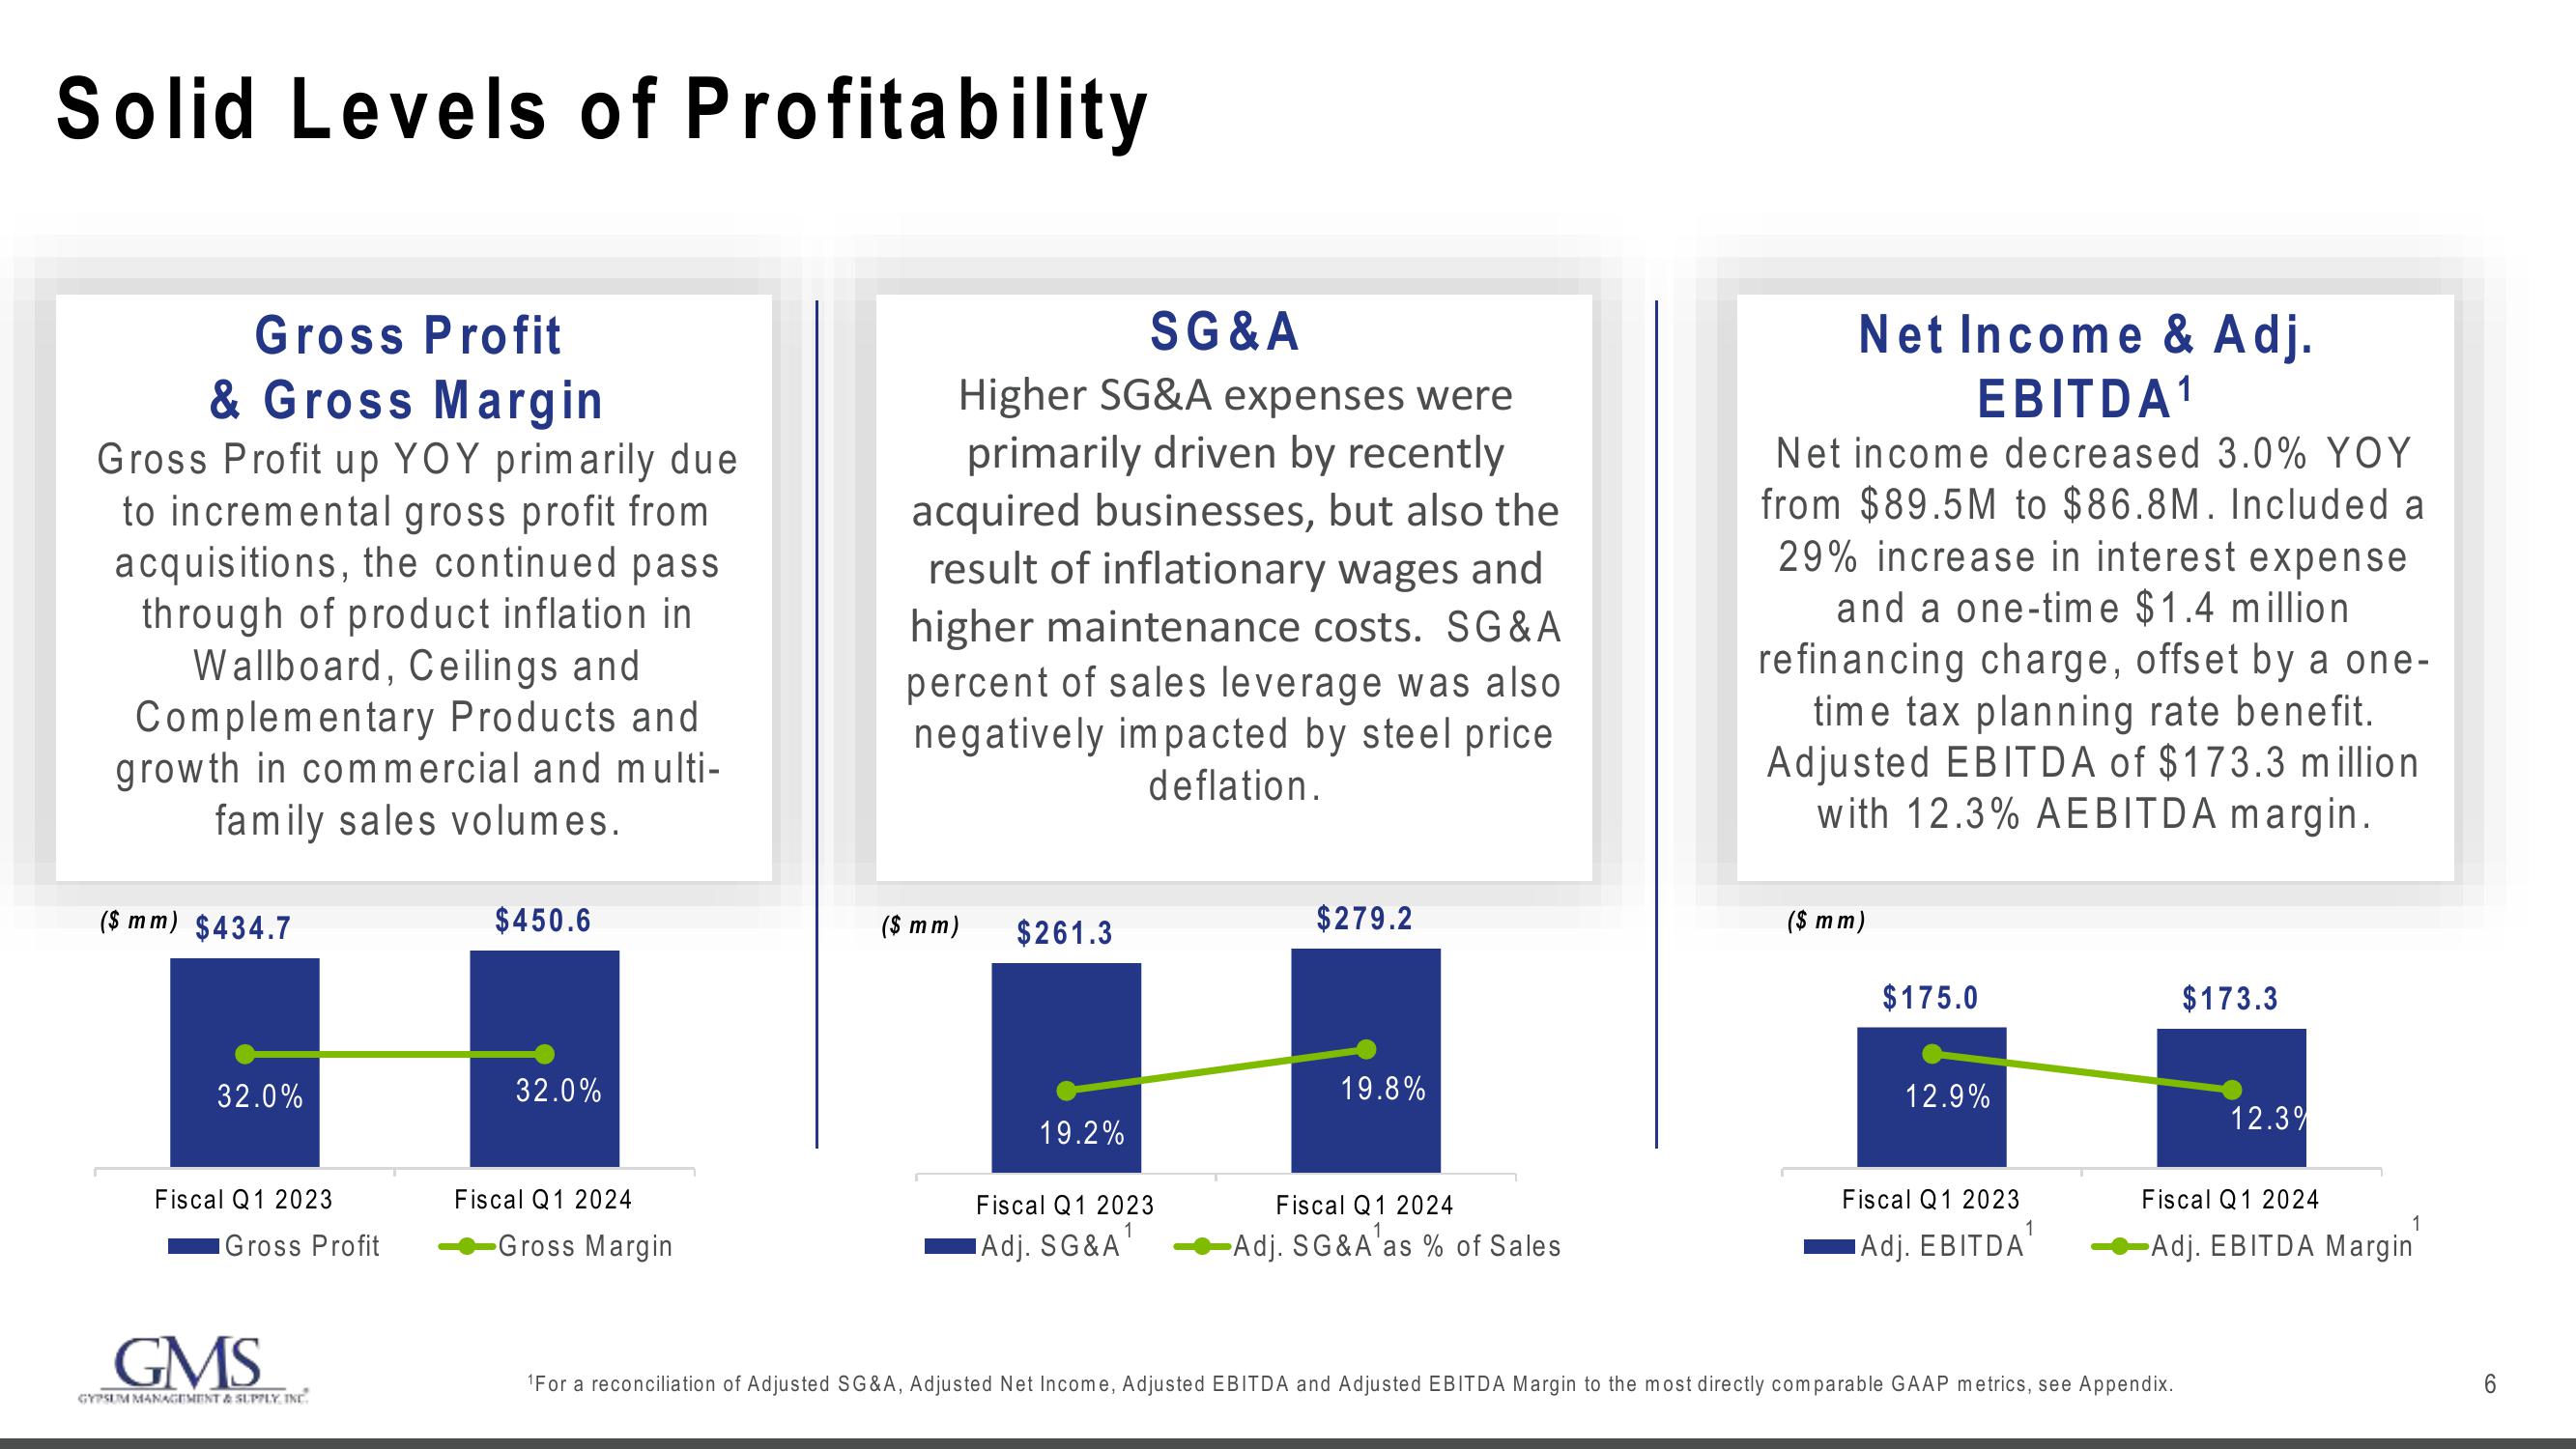
Gross Profit up YOY primarily due
to incremental gross profit from
acquisitions, the continued pass
through of product inflation in
Wallboard, Ceilings and
Complementary Products and
growth in commercial and multi-
family sales volumes.
($ mm) $434.7
32.0%
Fiscal Q1 2023
Gross Profit
GMS
GYPSUM MANAGEMENT & SUPPLY INC.
$450.6
32.0%
Fiscal Q1 2024
Gross Margin
SG&A
Higher SG&A expenses were
primarily driven by recently
acquired businesses, but also the
result of inflationary wages and
higher maintenance costs. SG & A
percent of sales leverage was also
negatively impacted by steel price
deflation.
($ mm)
$261.3
19.2%
Fiscal Q1 2023
Adj. SG&A
$279.2
19.8%
Fiscal Q1 2024
-Adj. SG&A as % of Sales
Net Income & Adj.
EBITDA¹
Net income decreased 3.0% YOY
from $89.5M to $86.8M. Included a
29% increase in interest expense
and a one-time $1.4 million
refinancing charge, offset by a one-
time tax planning rate benefit.
Adjusted EBITDA of $173.3 million
with 12.3% AEBITDA margin.
($ mm)
$175.0
12.9%
Fiscal Q1 2023
1
Adj. EBITDA
$173.3
¹For a reconciliation of Adjusted SG&A, Adjusted Net Income, Adjusted EBITDA and Adjusted EBITDA Margin to the most directly comparable GAAP metrics, see Appendix.
12.3%
Fiscal Q1 2024
1
-Adj. EBITDA Margin
6View entire presentation