DraftKings Mergers and Acquisitions Presentation Deck
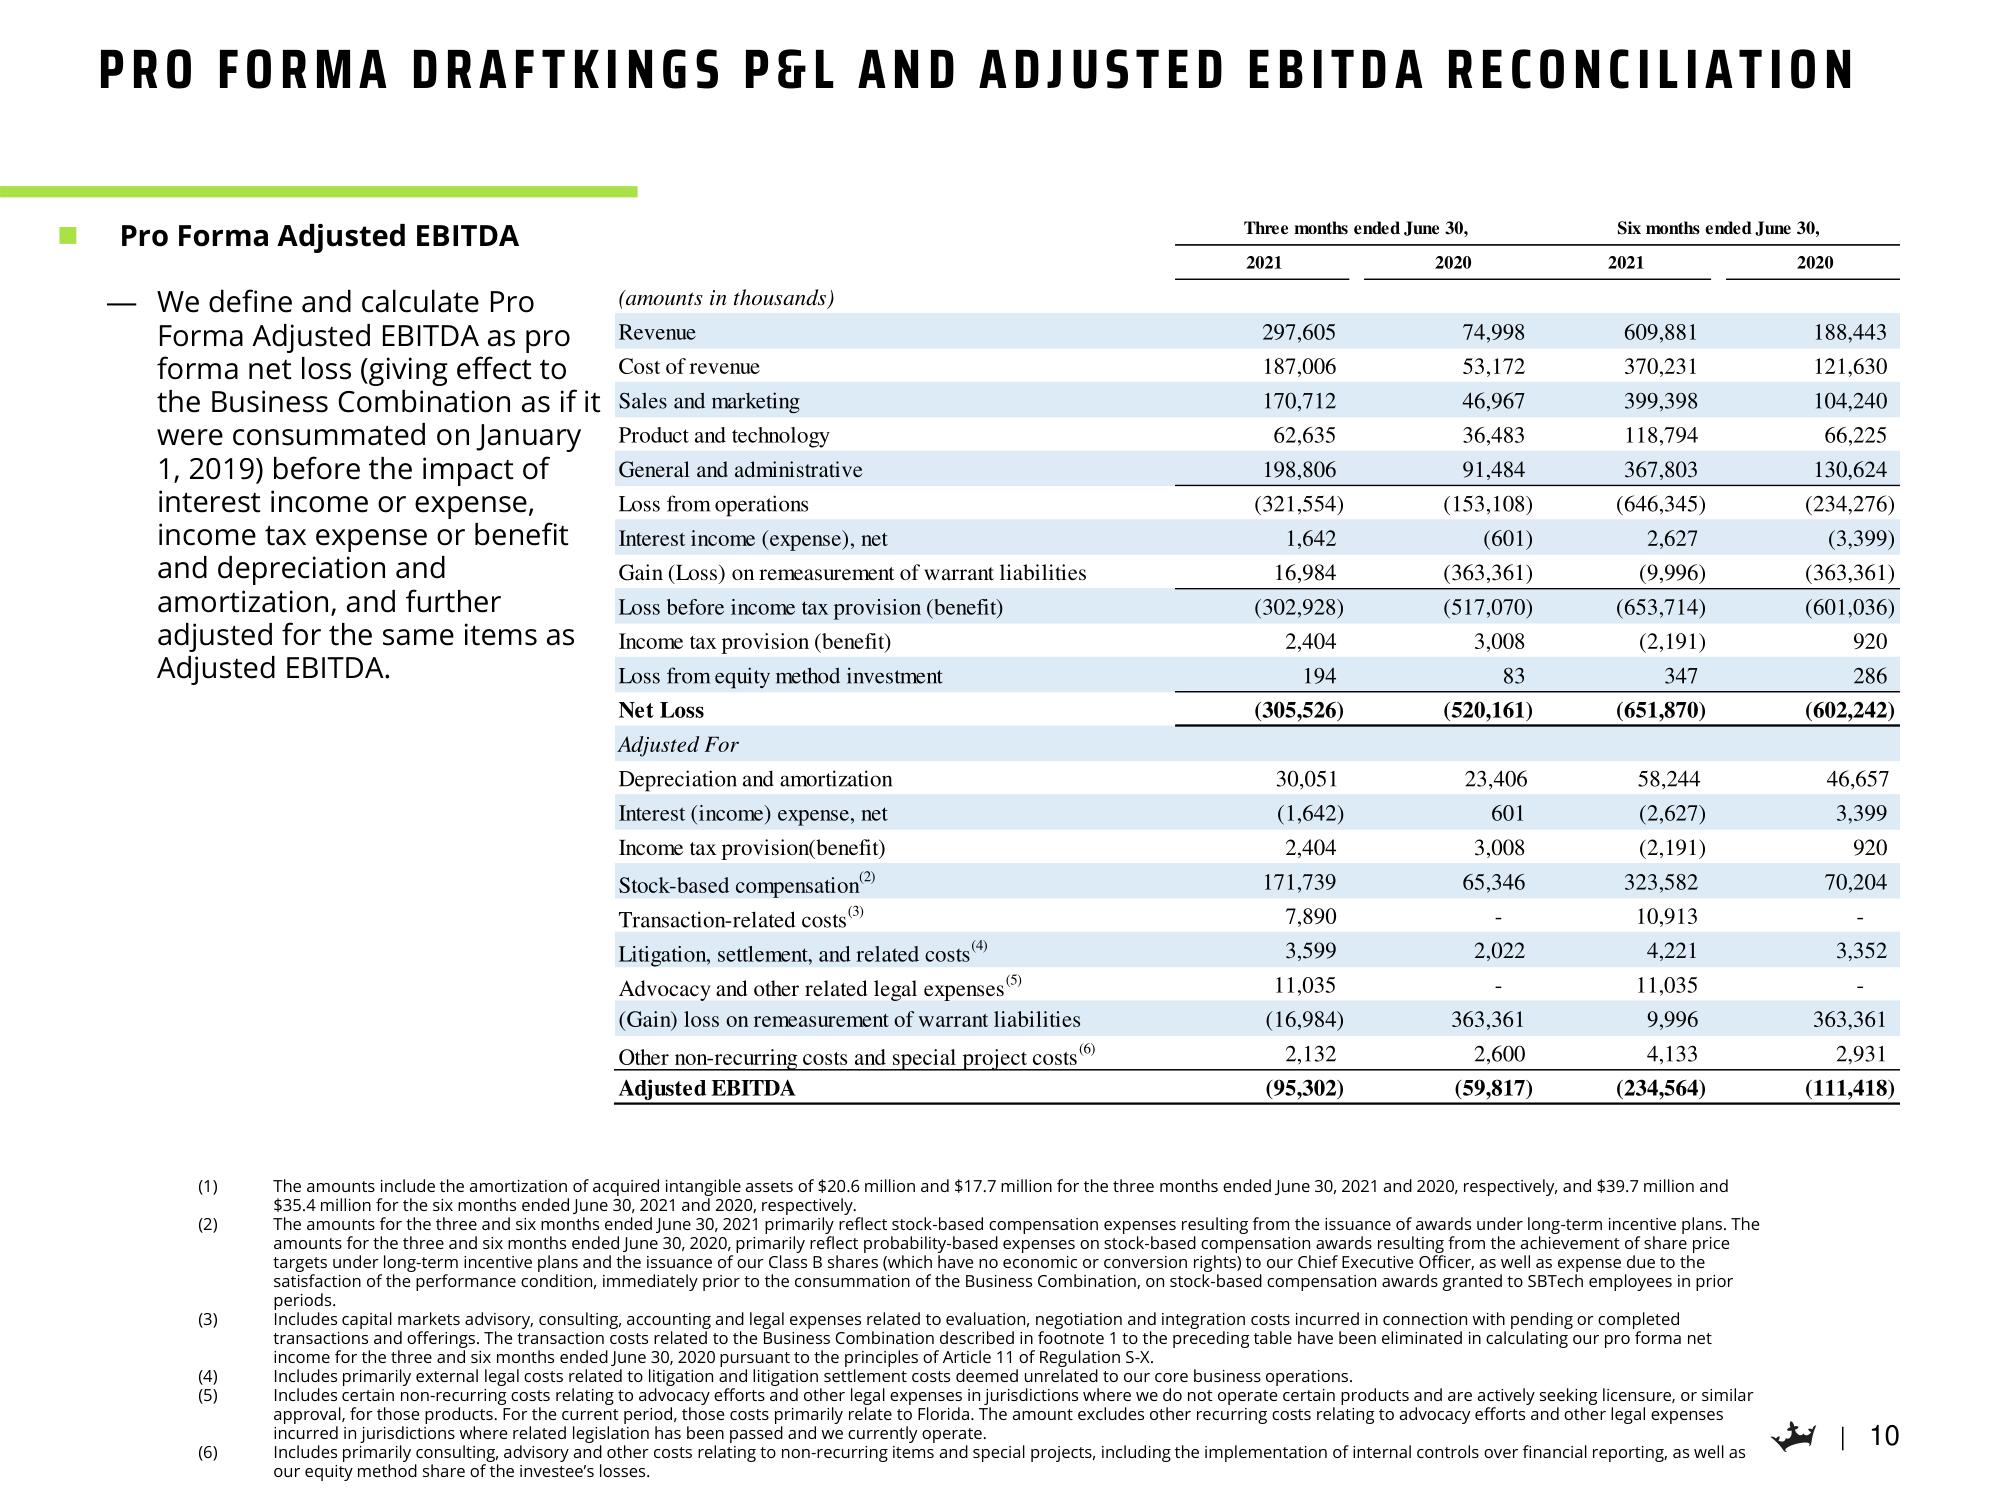
PRO FORMA DRAFTKINGS P&L AND ADJUSTED EBITDA RECONCILIATION
Pro Forma Adjusted EBITDA
We define and calculate Pro
Forma Adjusted EBITDA as pro
forma net loss (giving effect to
the Business Combination as if it
were consummated on January
1, 2019) before the impact of
interest income or expense,
income tax expense or benefit
and depreciation and
amortization, and further
adjusted for the same items as
Adjusted EBITDA.
(1)
(2)
(3)
(4)
(5)
(6)
(amounts in thousands)
Revenue
Cost of revenue
Sales and marketing
Product and technology
General and administrative
Loss from operations
Interest income (expense), net
Gain (Loss) on remeasurement of warrant liabilities
Loss before income tax provision (benefit)
Income tax provision (benefit)
Loss from equity method investment
Net Loss
Adjusted For
Depreciation and amortization
Interest (income) expense, net
Income tax provision(benefit)
Stock-based compensation²)
Transaction-related costs (3)
(2)
(4)
Litigation, settlement, and related costs
Advocacy and other related legal expenses
(Gain) loss on remeasurement of warrant liabilities
Other non-recurring costs and special project costs)
Adjusted EBITDA
(5)
Three months ended June 30,
2021
2020
297,605
187,006
170,712
62,635
198,806
(321,554)
1,642
16,984
(302,928)
2,404
194
(305,526)
30,051
(1,642)
2,404
171,739
7,890
3,599
11,035
(16,984)
2,132
(95,302)
74,998
53,172
46,967
36,483
91,484
(153,108)
(601)
(363,361)
(517,070)
3,008
83
(520,161)
23,406
601
3,008
65,346
2,022
363,361
2,600
(59,817)
Six months ended June 30,
2021
2020
609,881
370,231
399,398
118,794
367,803
(646,345)
2,627
(9,996)
(653,714)
(2,191)
347
(651,870)
58,244
(2,627)
(2,191)
323,582
10,913
4,221
11,035
9,996
4,133
(234,564)
The amounts include the amortization of acquired intangible assets of $20.6 million and $17.7 million for the three months ended June 30, 2021 and 2020, respectively, and $39.7 million and
$35.4 million for the six months ended June 30, 2021 and 2020, respectively.
The amounts for the three and six months ended June 30, 2021 primarily reflect stock-based compensation expenses resulting from the issuance of awards under long-term incentive plans. The
amounts for the three and six months ended June 30, 2020, primarily reflect probability-based expenses on stock-based compensation awards resulting from the achievement of share price
targets under long-term incentive plans and the issuance of our Class B shares (which have no economic or conversion rights) to our Chief Executive Officer, as well as expense due to the
satisfaction of the performance condition, immediately prior to the consummation of the Business Combination, on stock-based compensation awards granted to SBTech employees in prior
periods.
Includes capital markets advisory, consulting, accounting and legal expenses related to evaluation, negotiation and integration costs incurred in connection with pending or completed
transactions and offerings. The transaction costs related to the Business Combination described in footnote 1 to the preceding table have been eliminated in calculating our pro forma net
income for the three and six months ended June 30, 2020 pursuant to the principles of Article 11 of Regulation S-X.
Includes primarily external legal costs related to litigation and litigation settlement costs deemed unrelated to our core business operations.
Includes certain non-recurring costs relating to advocacy efforts and other legal expenses in jurisdictions where we do not operate certain products and are actively seeking licensure, or similar
approval, for those products. For the current period, those costs primarily relate to Florida. The amount excludes other recurring costs relating to advocacy efforts and other legal expenses
incurred in jurisdictions where related legislation has been passed and we currently operate.
Includes primarily consulting, advisory and other costs relating to non-recurring items and special projects, including the implementation of internal controls over financial reporting, as well as
our equity method share of the investee's losses.
188,443
121,630
104,240
66,225
130,624
(234,276)
(3,399)
(363,361)
(601,036)
920
286
(602,242)
46,657
3,399
920
70,204
3,352
363,361
2,931
(111,418)
| 10View entire presentation