Credit Suisse Results Presentation Deck
Investment Bank
Pre-tax loss driven by impact of strategic actions and continued challenging market conditions
Revenues
PCL/
Costs
Profitability
Balance
sheet
in USD mn
Fixed income sales & trading
Equity sales & trading
Capital markets
Advisory and other fees
Other¹
Adjusted net revenues
Adjusted provision for credit
losses
Adjusted total operating expenses
Adjusted pre-tax income/(loss)
Reported pre-tax income/(loss)
Adjusted RORC+
Reported RoRC+
Adjusted cost/income ratio
Risk-weighted assets in USD bn
Leverage exposure in USD bn
4Q22
81
15
200
175
(6)
465
24
80
3Q22
229
558
248
99
232
(1)
1,136
(6)
1,782
1,700
2,007
(1,259)
(640) (184)
(1,524) (691) (2,174)
(33)% (15)%
(4)%
(40)% (16)%
(45)%
110%
366% 157%
84
4Q21 A 4Q21
324
504 (84)%
403 (96)%
585 (66)%
(47)%
(3) n/m
1,820 (74)%
331
(15)%
n/m
n/m
92 (13)%
380 (40)%
2022
2,063
1,150
803
818
(63)
4,771
73
7,512
(2,814)
(3,246)
(16)%
(19)%
157%
80
229
2021
3,861
1,959
3,923
1,106
505
11,354
(109)
7,948
3,515
(3,672)
17%
(18)%
70%
92
A 2021
(47)%
(41)%
(80)%
(26)%
n/m
(58)%
(5)%
n/m
n/m
(13)%
380 (40)%
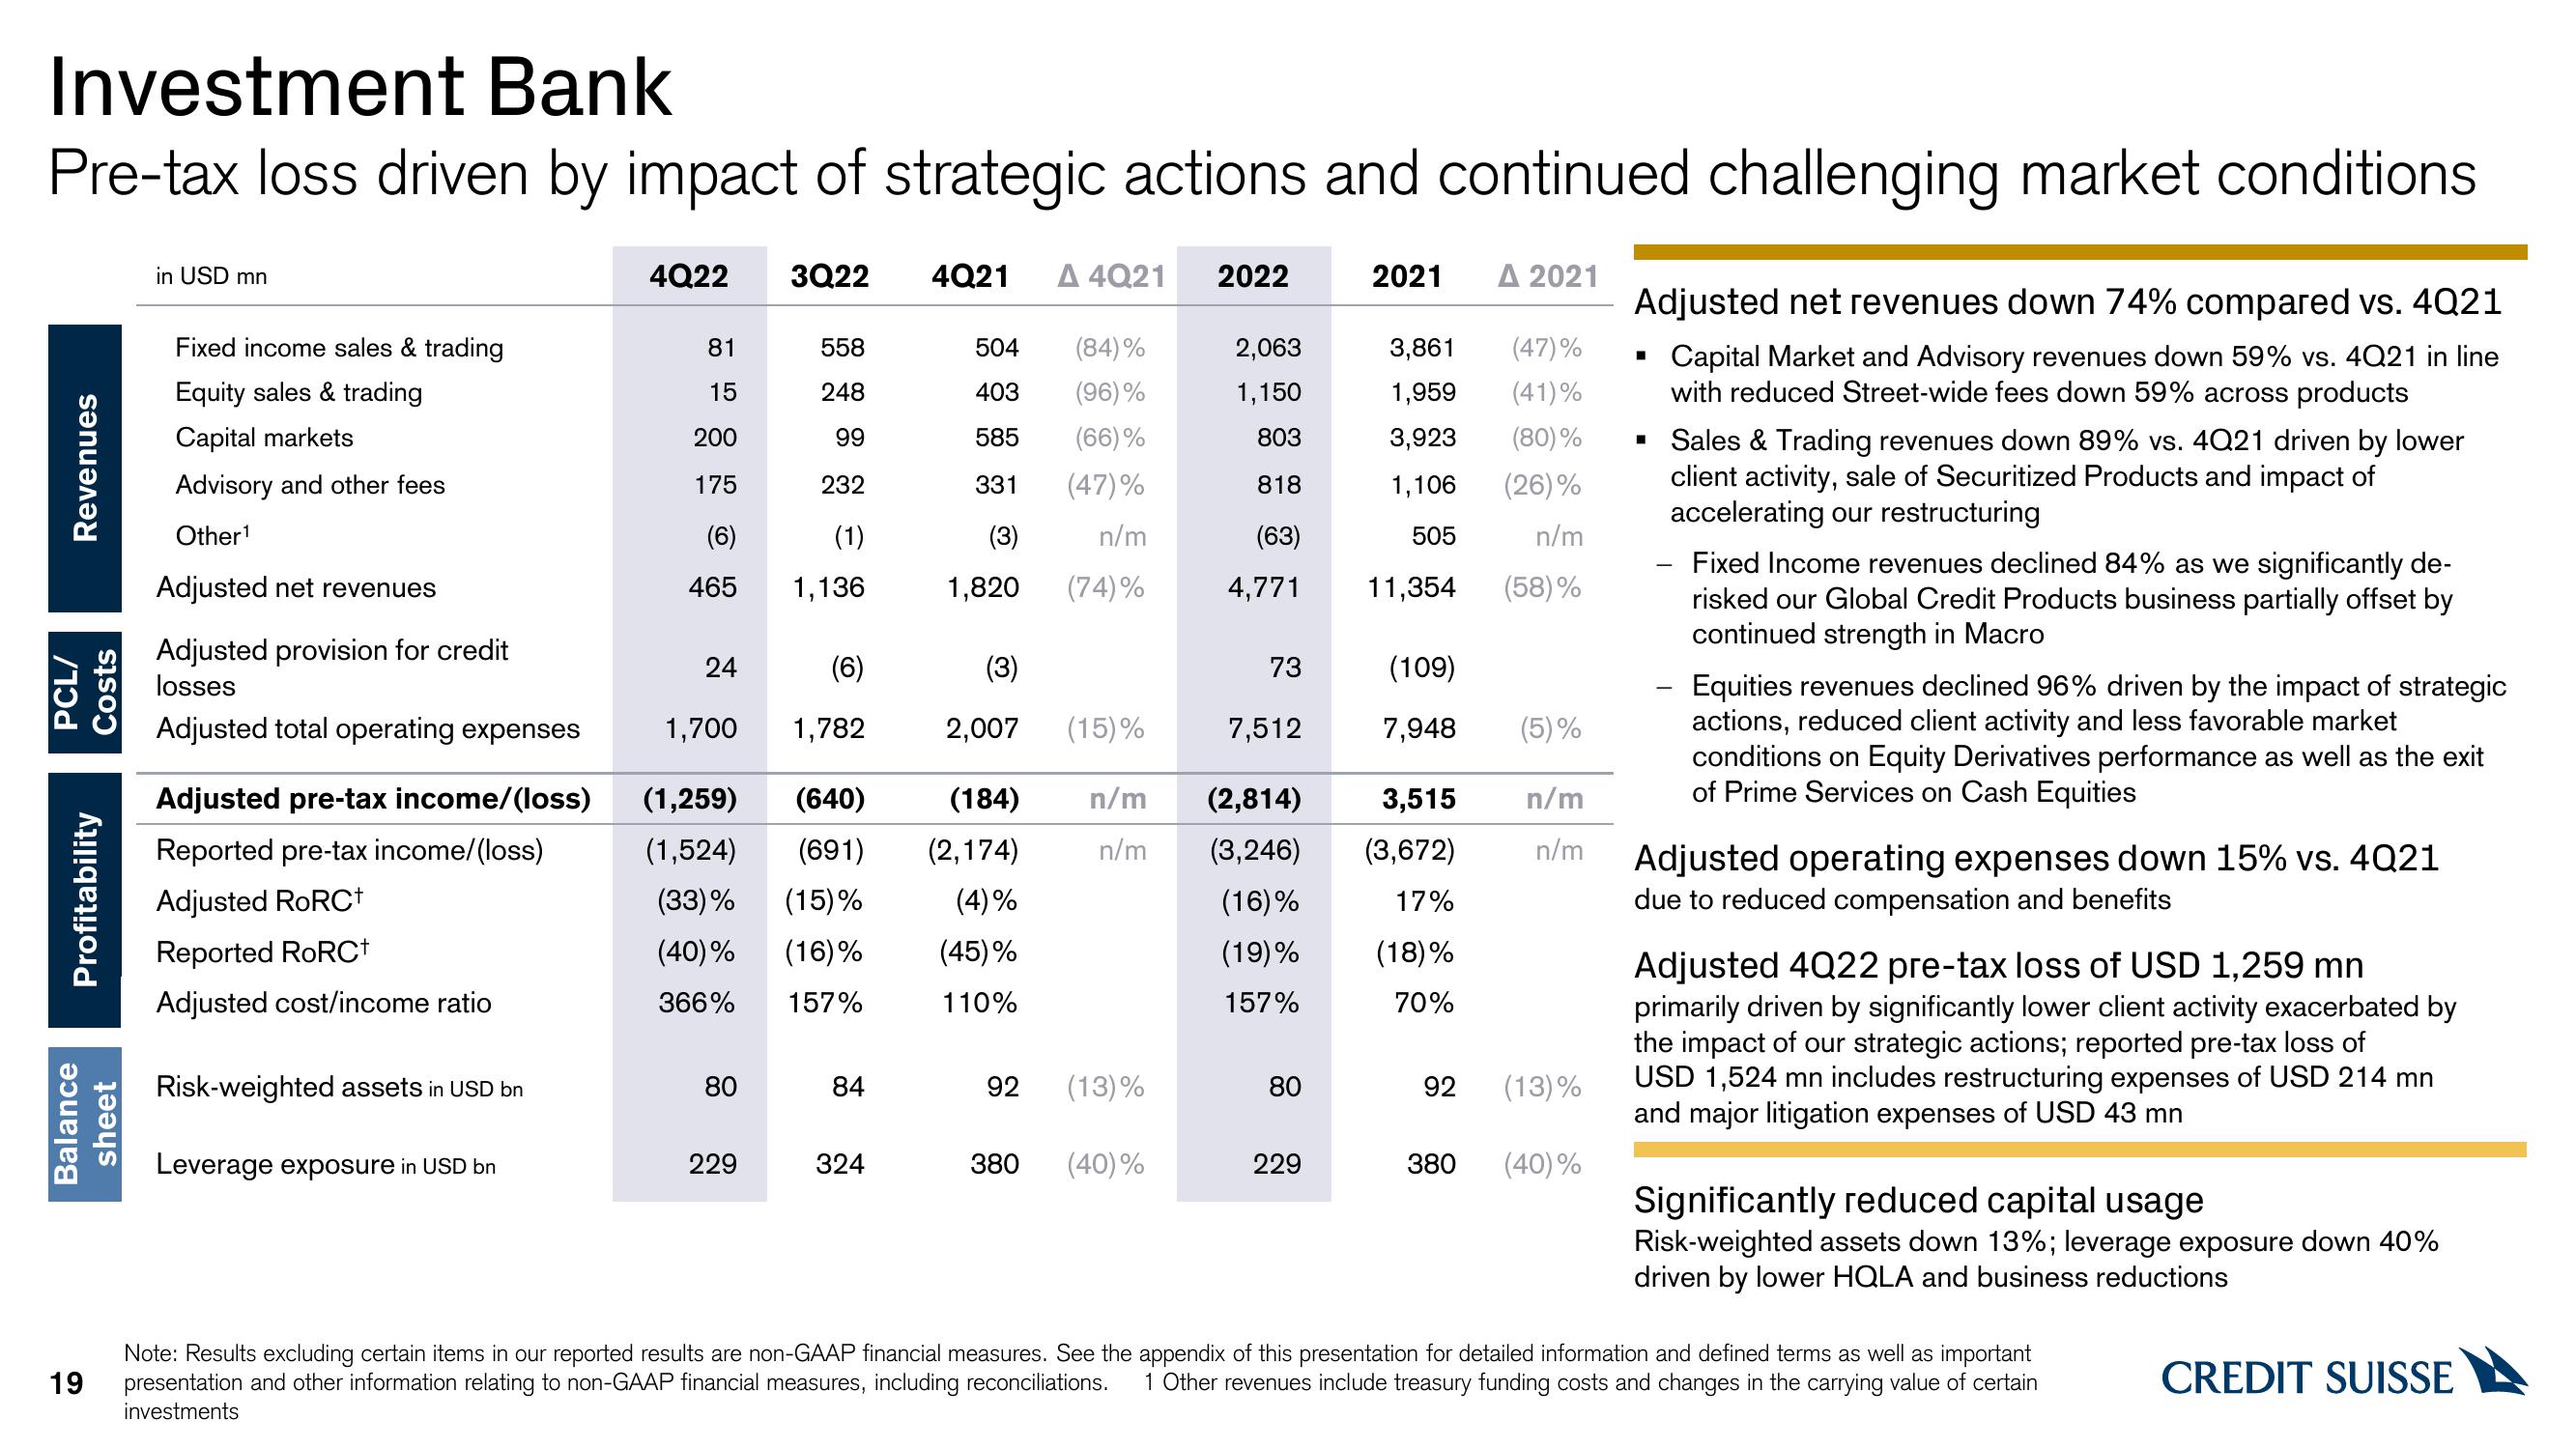
Adjusted net revenues down 74% compared vs. 4Q21
Capital Market and Advisory revenues down 59% vs. 4Q21 in line
with reduced Street-wide fees down 59% across products
I
-
Sales & Trading revenues down 89% vs. 4Q21 driven by lower
client activity, sale of Securitized Products and impact of
accelerating our restructuring
Fixed Income revenues declined 84% as we significantly de-
risked our Global Credit Products business partially offset by
continued strength in Macro
Equities revenues declined 96% driven by the impact of strategic
actions, reduced client activity and less favorable market
conditions on Equity Derivatives performance as well as the exit
of Prime Services on Cash Equities
Adjusted operating expenses down 15% vs. 4Q21
due to reduced compensation and benefits
Adjusted 4Q22 pre-tax loss of USD 1,259 mn
primarily driven by significantly lower client activity exacerbated by
the impact of our strategic actions; reported pre-tax loss of
USD 1,524 mn includes restructuring expenses of USD 214 mn
and major litigation expenses of USD 43 mn
Significantly reduced capital usage
Risk-weighted assets down 13%; leverage exposure down 40%
driven by lower HQLA and business reductions
Note: Results excluding certain items in our reported results are non-GAAP financial measures. See the appendix of this presentation for detailed information and defined terms as well as important
19 presentation and other information relating to non-GAAP financial measures, including reconciliations. 1 Other revenues include treasury funding costs and changes in the carrying value of certain
investments
CREDIT SUISSEView entire presentation