Allwyn Investor Conference Presentation Deck
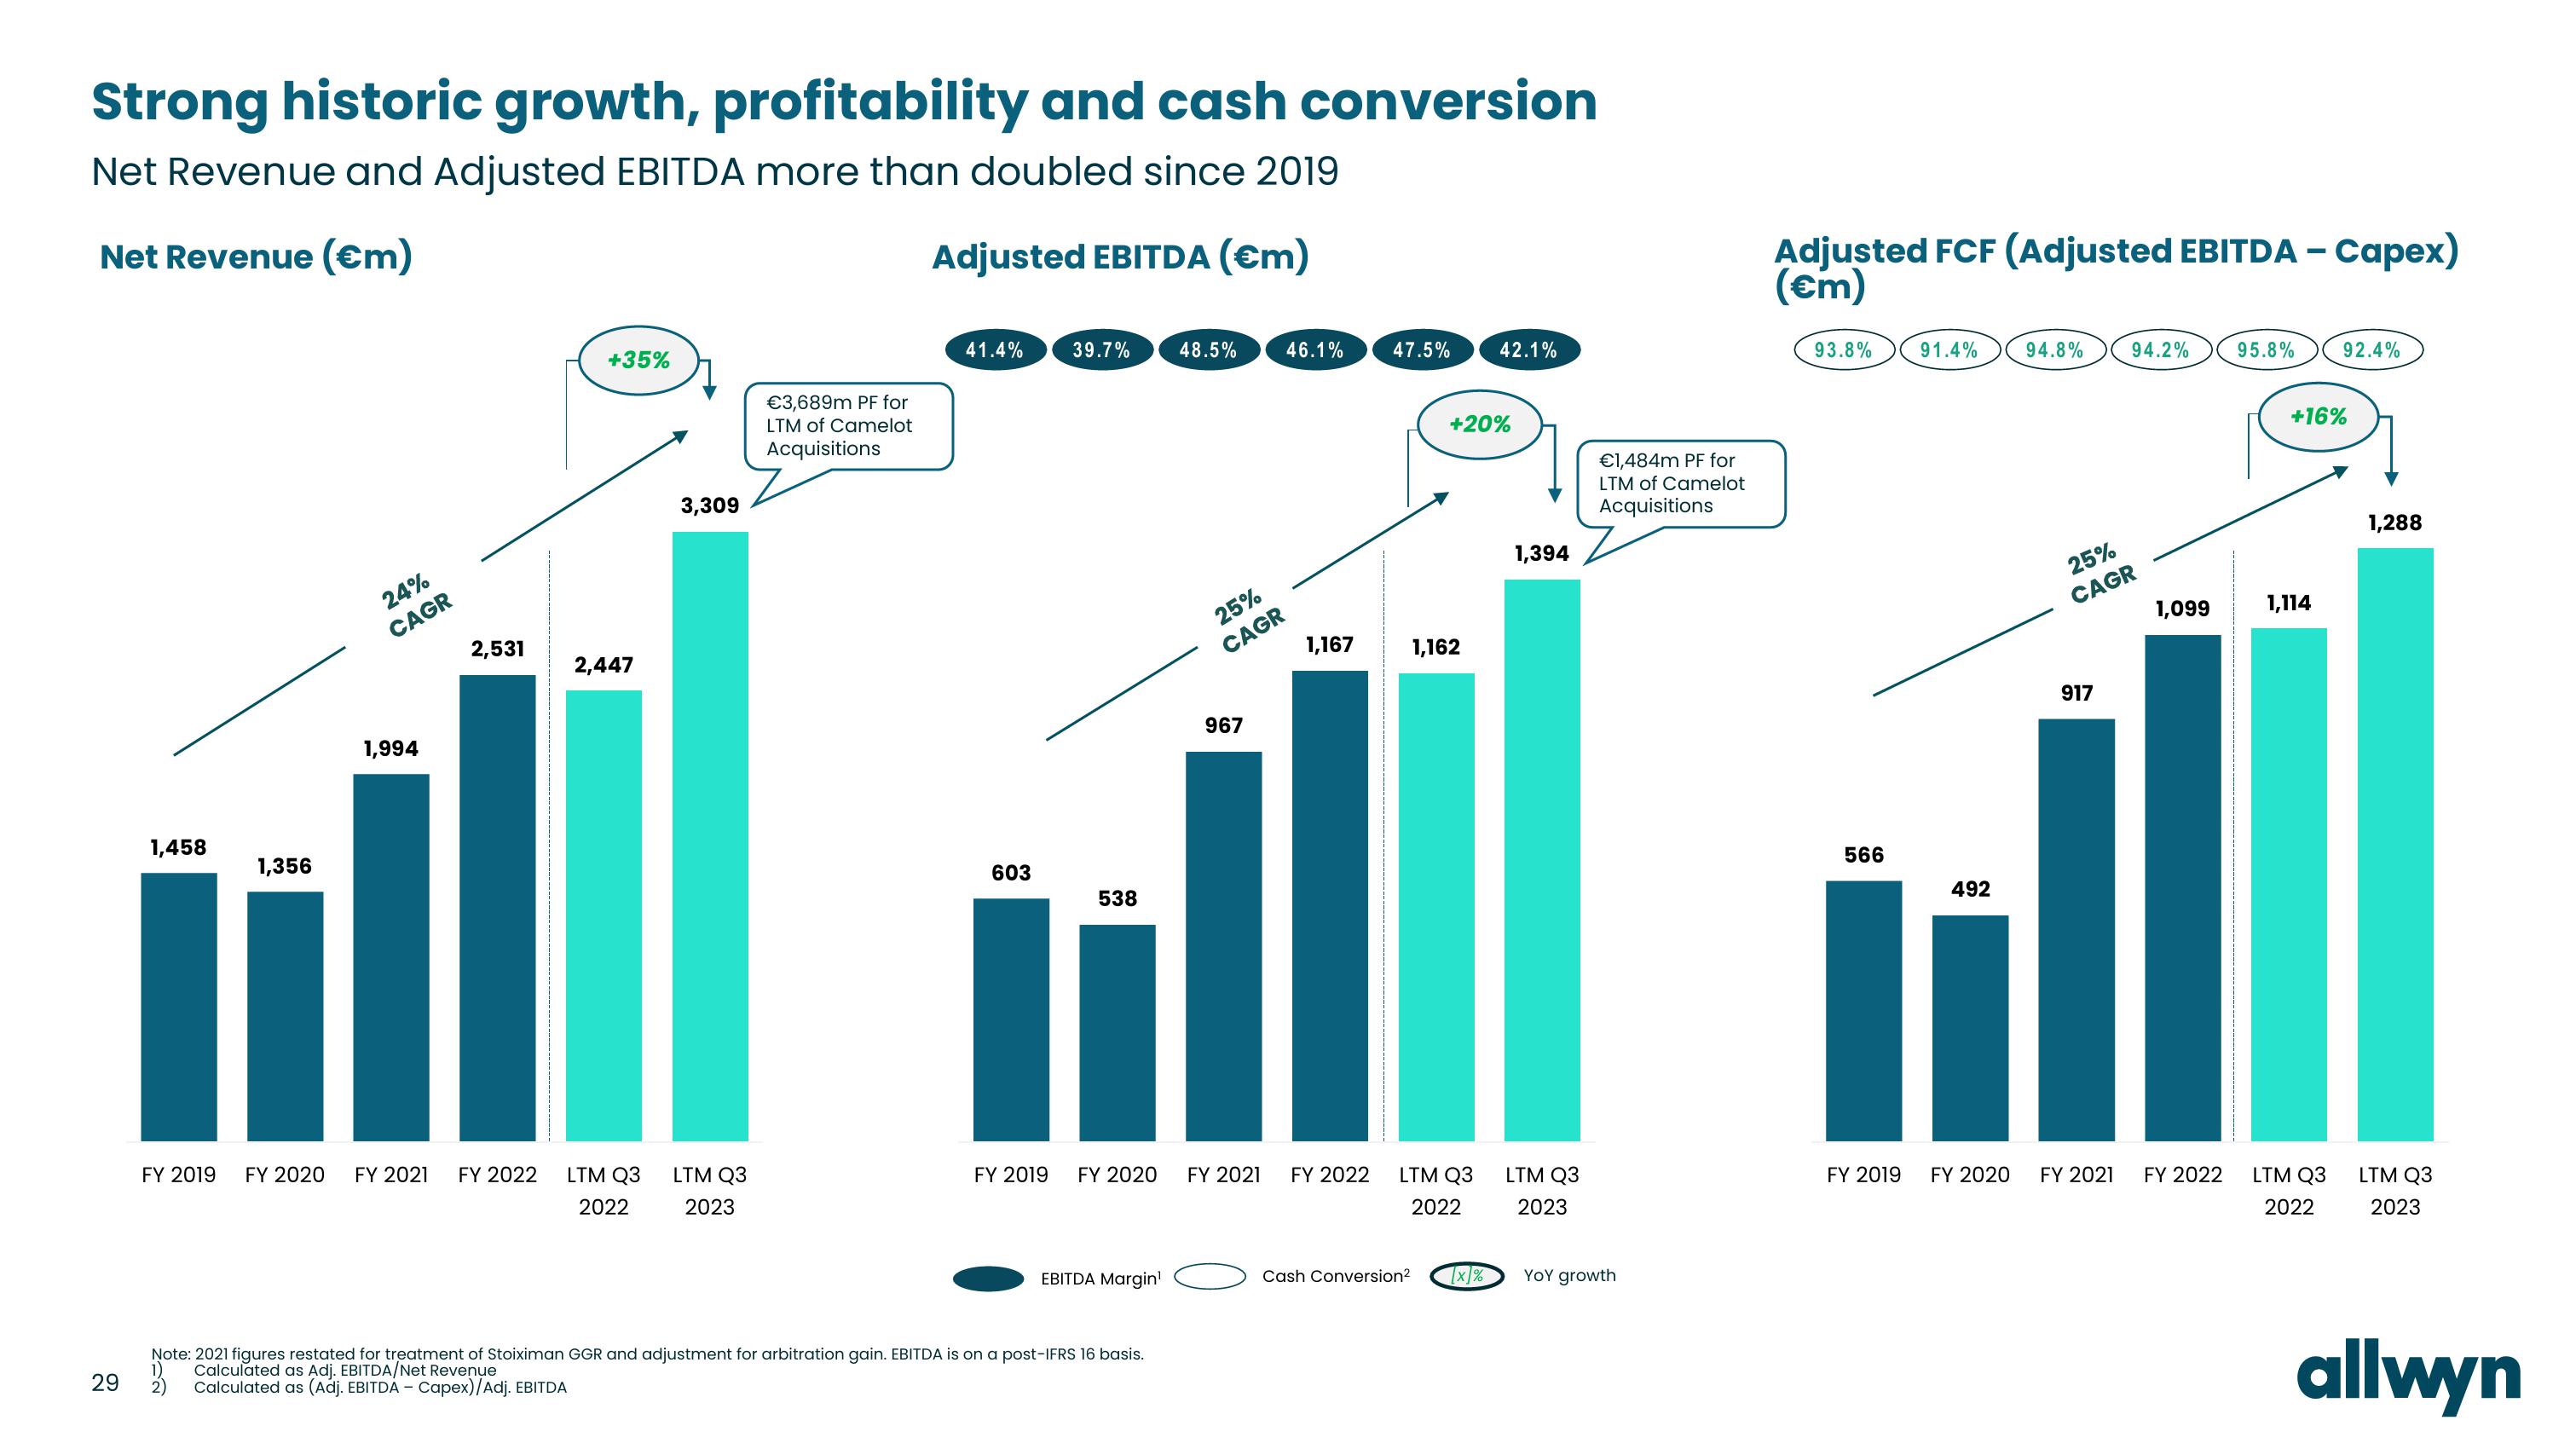
Strong historic growth, profitability and cash conversion
Net Revenue and Adjusted EBITDA more than doubled since 2019
Net Revenue (€m)
Adjusted EBITDA (€m)
29
1,458
1,356
FY 2019 FY 2020
1)
2)
24%
CAGR
1,994
2,531
FY 2021 FY 2022
+35%
2,447
LTM Q3
2022
3,309
LTM Q3
2023
€3,689m PF for
LTM of Camelot
Acquisitions
41.4%
603
39.7% 48.5%
538
FY 2019 FY 2020
EBITDA Margin¹
Note: 2021 figures restated for treatment of Stoiximan GGR and adjustment for arbitration gain. EBITDA is on a post-IFRS 16 basis.
Calculated as Adj. EBITDA/Net Revenue
Calculated as (Adj. EBITDA - Capex)/Adj. EBITDA
25%
CAGR
967
46.1%
1,167
FY 2021 FY 2022
47.5%
Cash Conversion²
+20%
1,162
LTM Q3
2022
42.1%
[x]%
1,394
LTM Q3
2023
€1,484m PF for
LTM of Camelot
Acquisitions
YOY growth
Adjusted FCF (Adjusted EBITDA - Capex)
(€m)
93.8%
566
91.4%
492
FY 2019 FY 2020
94.8%
25%
CAGR
917
FY 2021
94.2%
1,099
FY 2022
95.8%
+16%
1,114
92.4%
LTM Q3
2022
1,288
LTM Q3
2023
allwynView entire presentation