Mondi Credit Presentation Deck
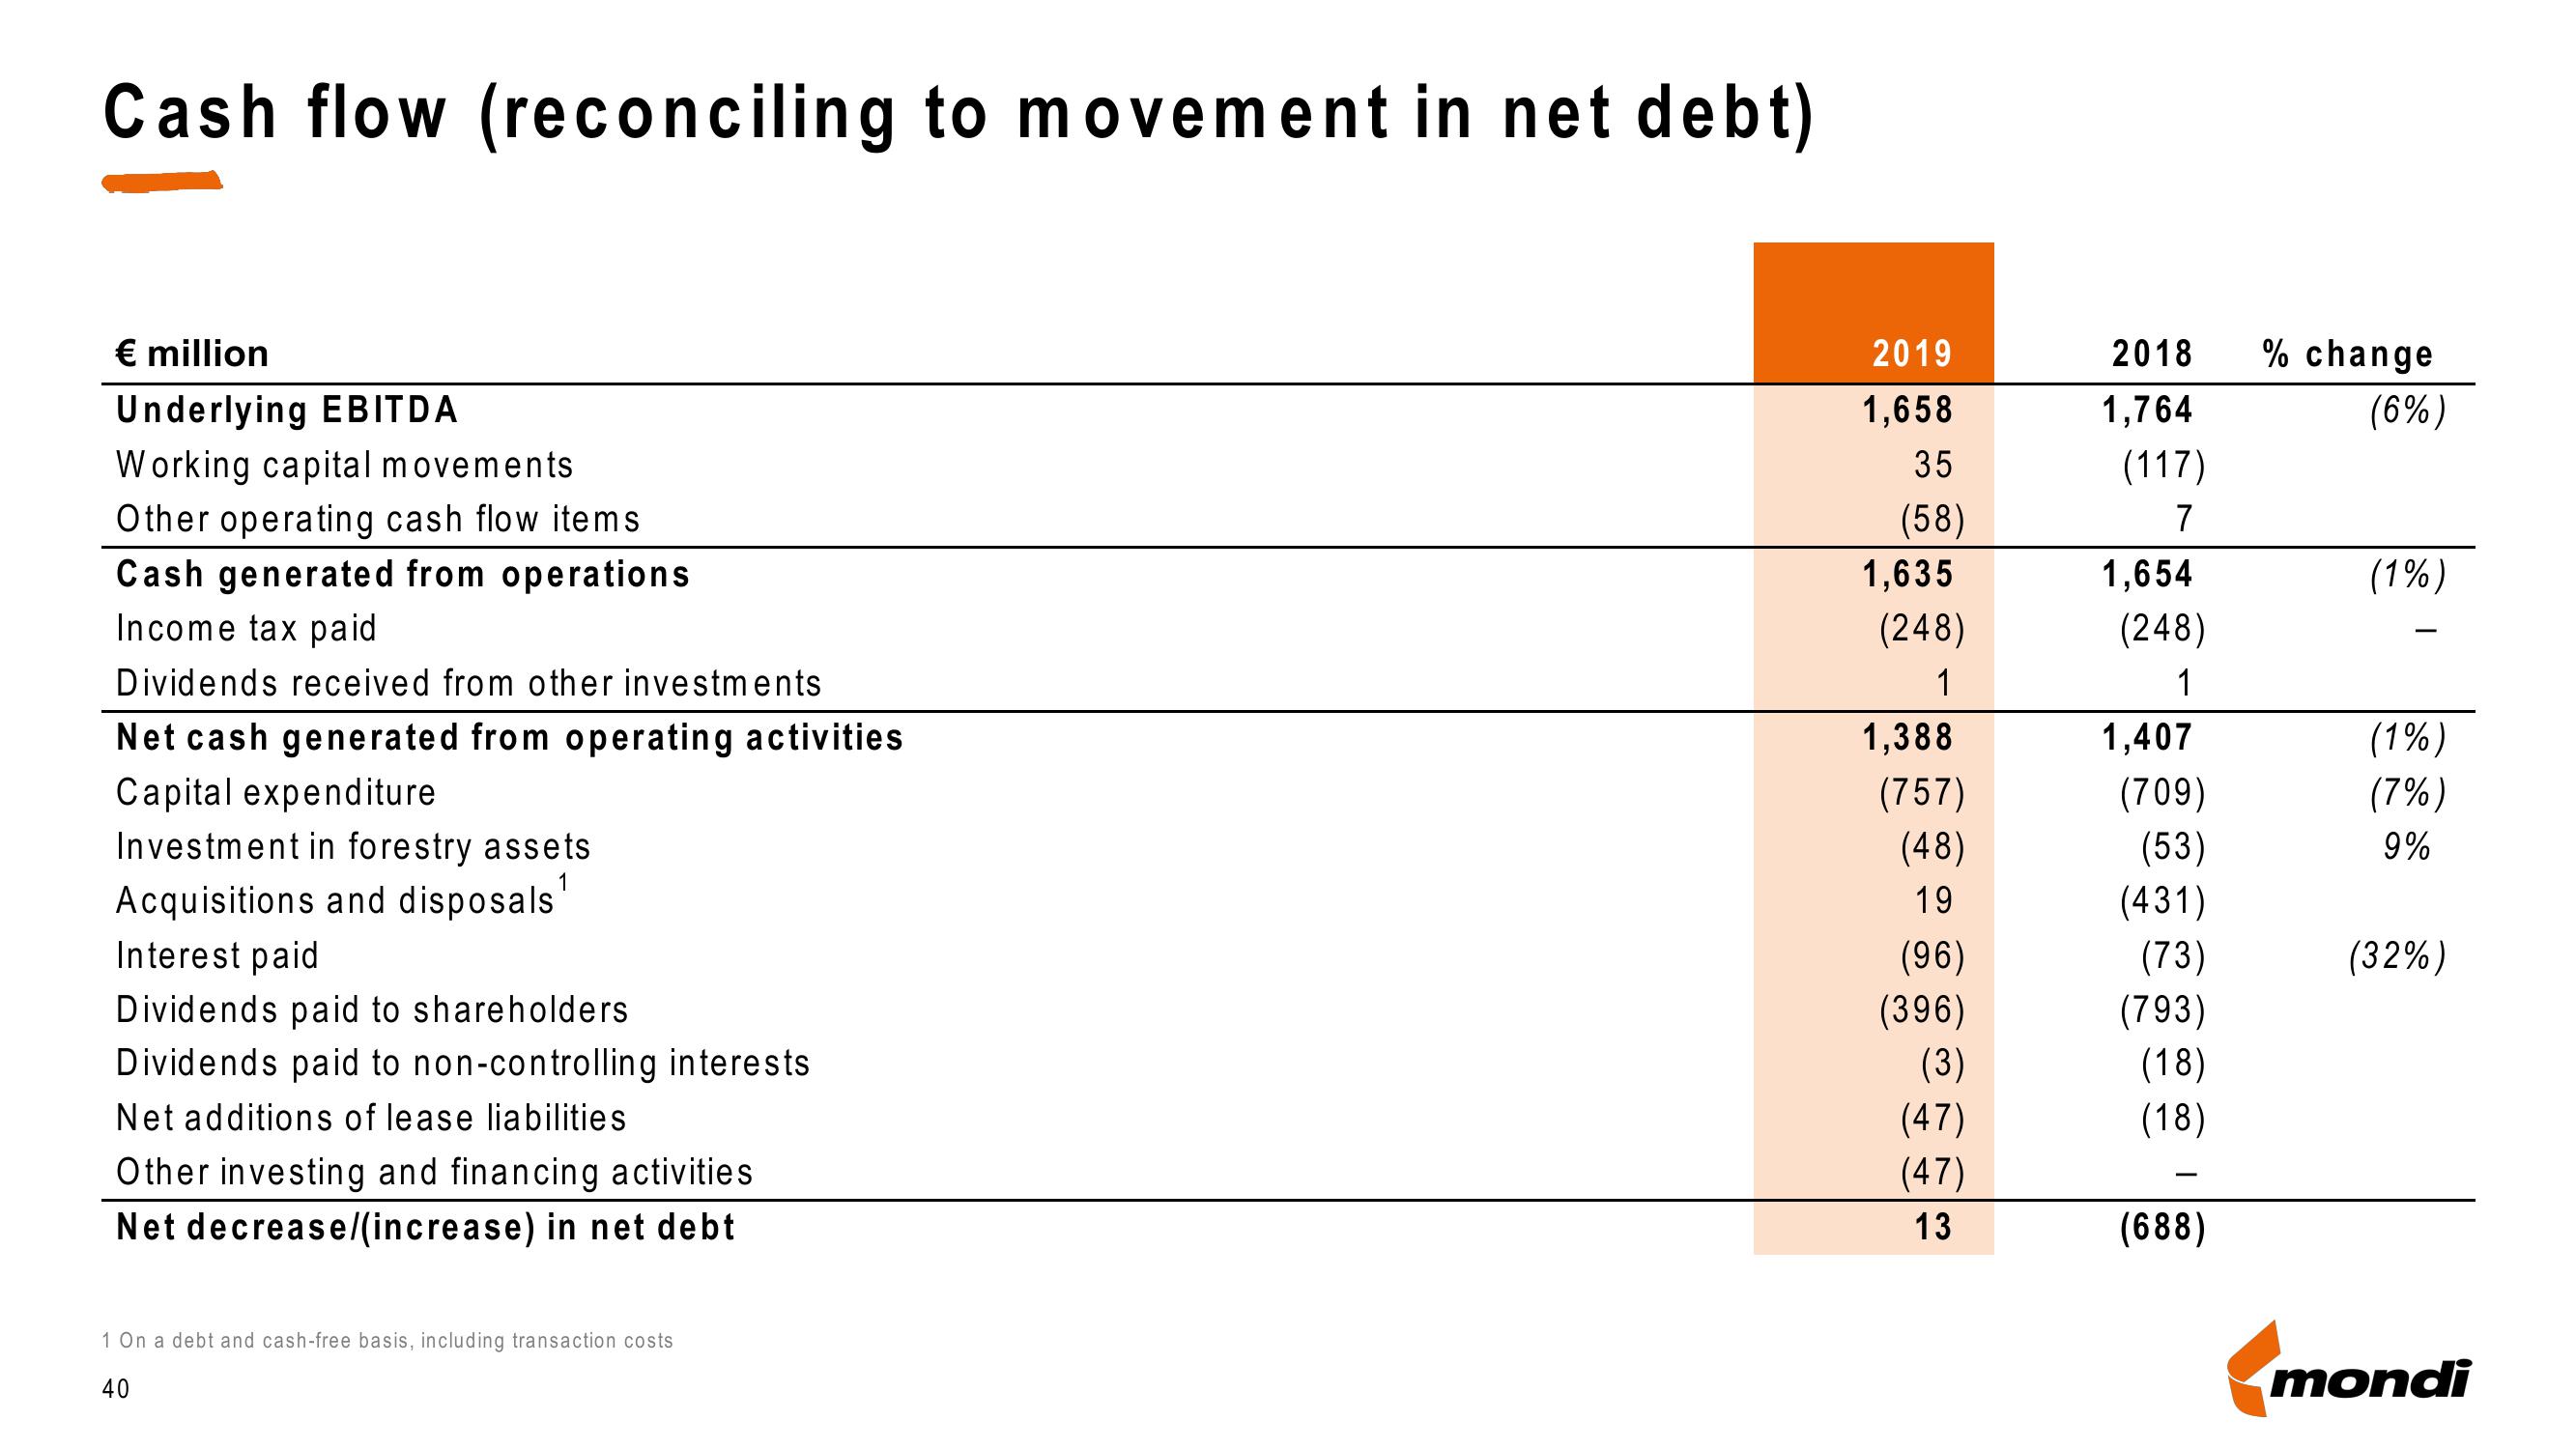
Cash flow (reconciling to movement in net debt)
€ million
Underlying EBITDA
Working capital movements
Other operating cash flow items
Cash generated from operations
Income tax paid
Dividends received from other investments
Net cash generated from operating activities
Capital expenditure
Investment in forestry assets
Acquisitions and disposals
Interest paid
Dividends paid to shareholders
Dividends paid to non-controlling interests
Net additions of lease liabilities
Other investing and financing activities
Net decrease/(increase) in net debt
1 On a debt and cash-free basis, including transaction costs
40
2019
1,658
35
(58)
1,635
(248)
1
1,388
(757)
(48)
19
(96)
(396)
(3)
(47)
(47)
13
2018
1,764
(117)
7
1,654
(248)
1
1,407
(709)
(53)
(431)
(73)
(793)
(18)
(18)
(688)
% change
(6%)
(1%)
(1%)
(7%)
9%
(32%)
mondiView entire presentation