Paysafe Results Presentation Deck
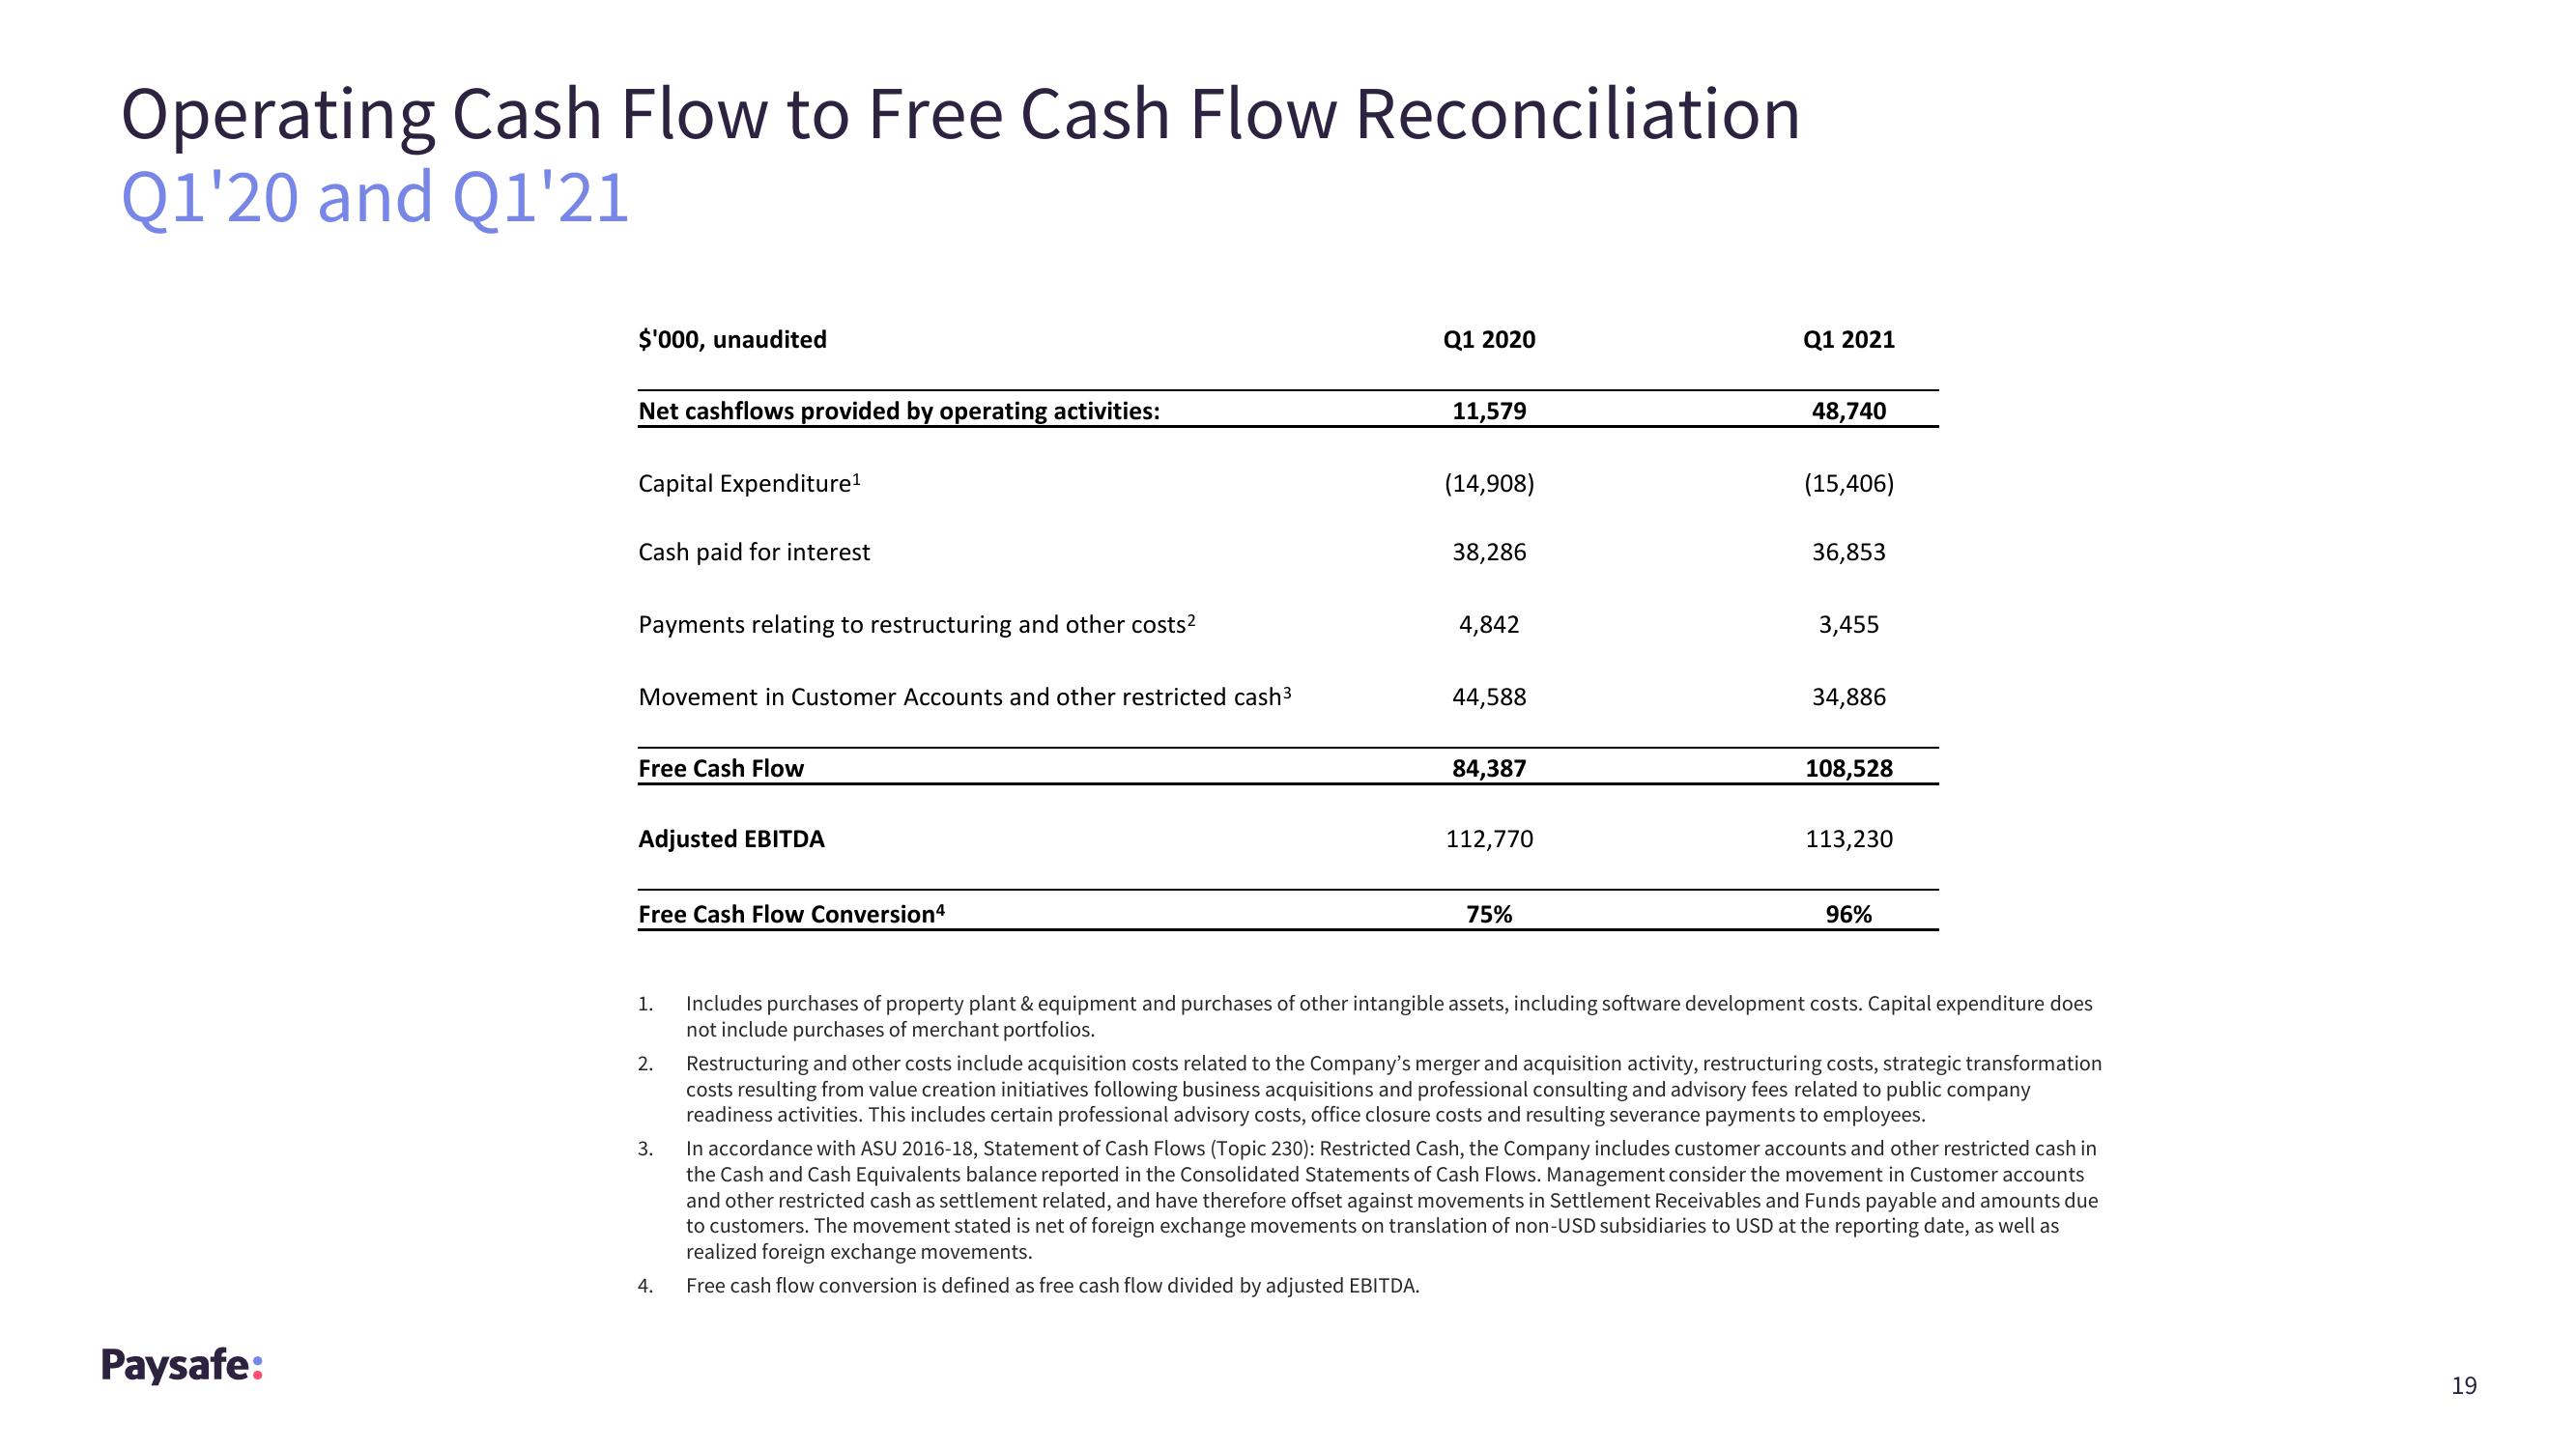
Operating Cash Flow to Free Cash Flow Reconciliation
Q1'20 and Q1'21
Paysafe:
$'000, unaudited
Net cashflows provided by operating activities:
Capital Expenditure¹
Cash paid for interest
Payments relating to restructuring and other costs²
Movement in Customer Accounts and other restricted cash³
Free Cash Flow
Adjusted EBITDA
Free Cash Flow Conversion4
1.
2.
3.
4.
Q1 2020
11,579
(14,908)
38,286
4,842
44,588
84,387
112,770
75%
Q1 2021
48,740
(15,406)
36,853
3,455
34,886
108,528
113,230
96%
Includes purchases of property plant & equipment and purchases of other intangible assets, including software development costs. Capital expenditure does
not include purchases of merchant portfolios.
Restructuring and other costs include acquisition costs related to the Company's merger and acquisition activity, restructuring costs, strategic transformation
costs resulting from value creation initiatives following business acquisitions and professional consulting and advisory fees related to public company
readiness activities. This includes certain professional advisory costs, office closure costs and resulting severance payments to employees.
In accordance with ASU 2016-18, Statement of Cash Flows (Topic 230): Restricted Cash, the Company includes customer accounts and other restricted cash in
the Cash and Cash Equivalents balance reported in the Consolidated Statements of Cash Flows. Management consider the movement in Customer accounts
and other restricted cash as settlement related, and have therefore offset against movements in Settlement Receivables and Funds payable and amounts due
to customers. The movement stated is net of foreign exchange movements on translation of non-USD subsidiaries to USD at the reporting date, as well as
realized foreign exchange movements.
Free cash flow conversion is defined as free cash flow divided by adjusted EBITDA.
19View entire presentation