LVMH Results Presentation Deck
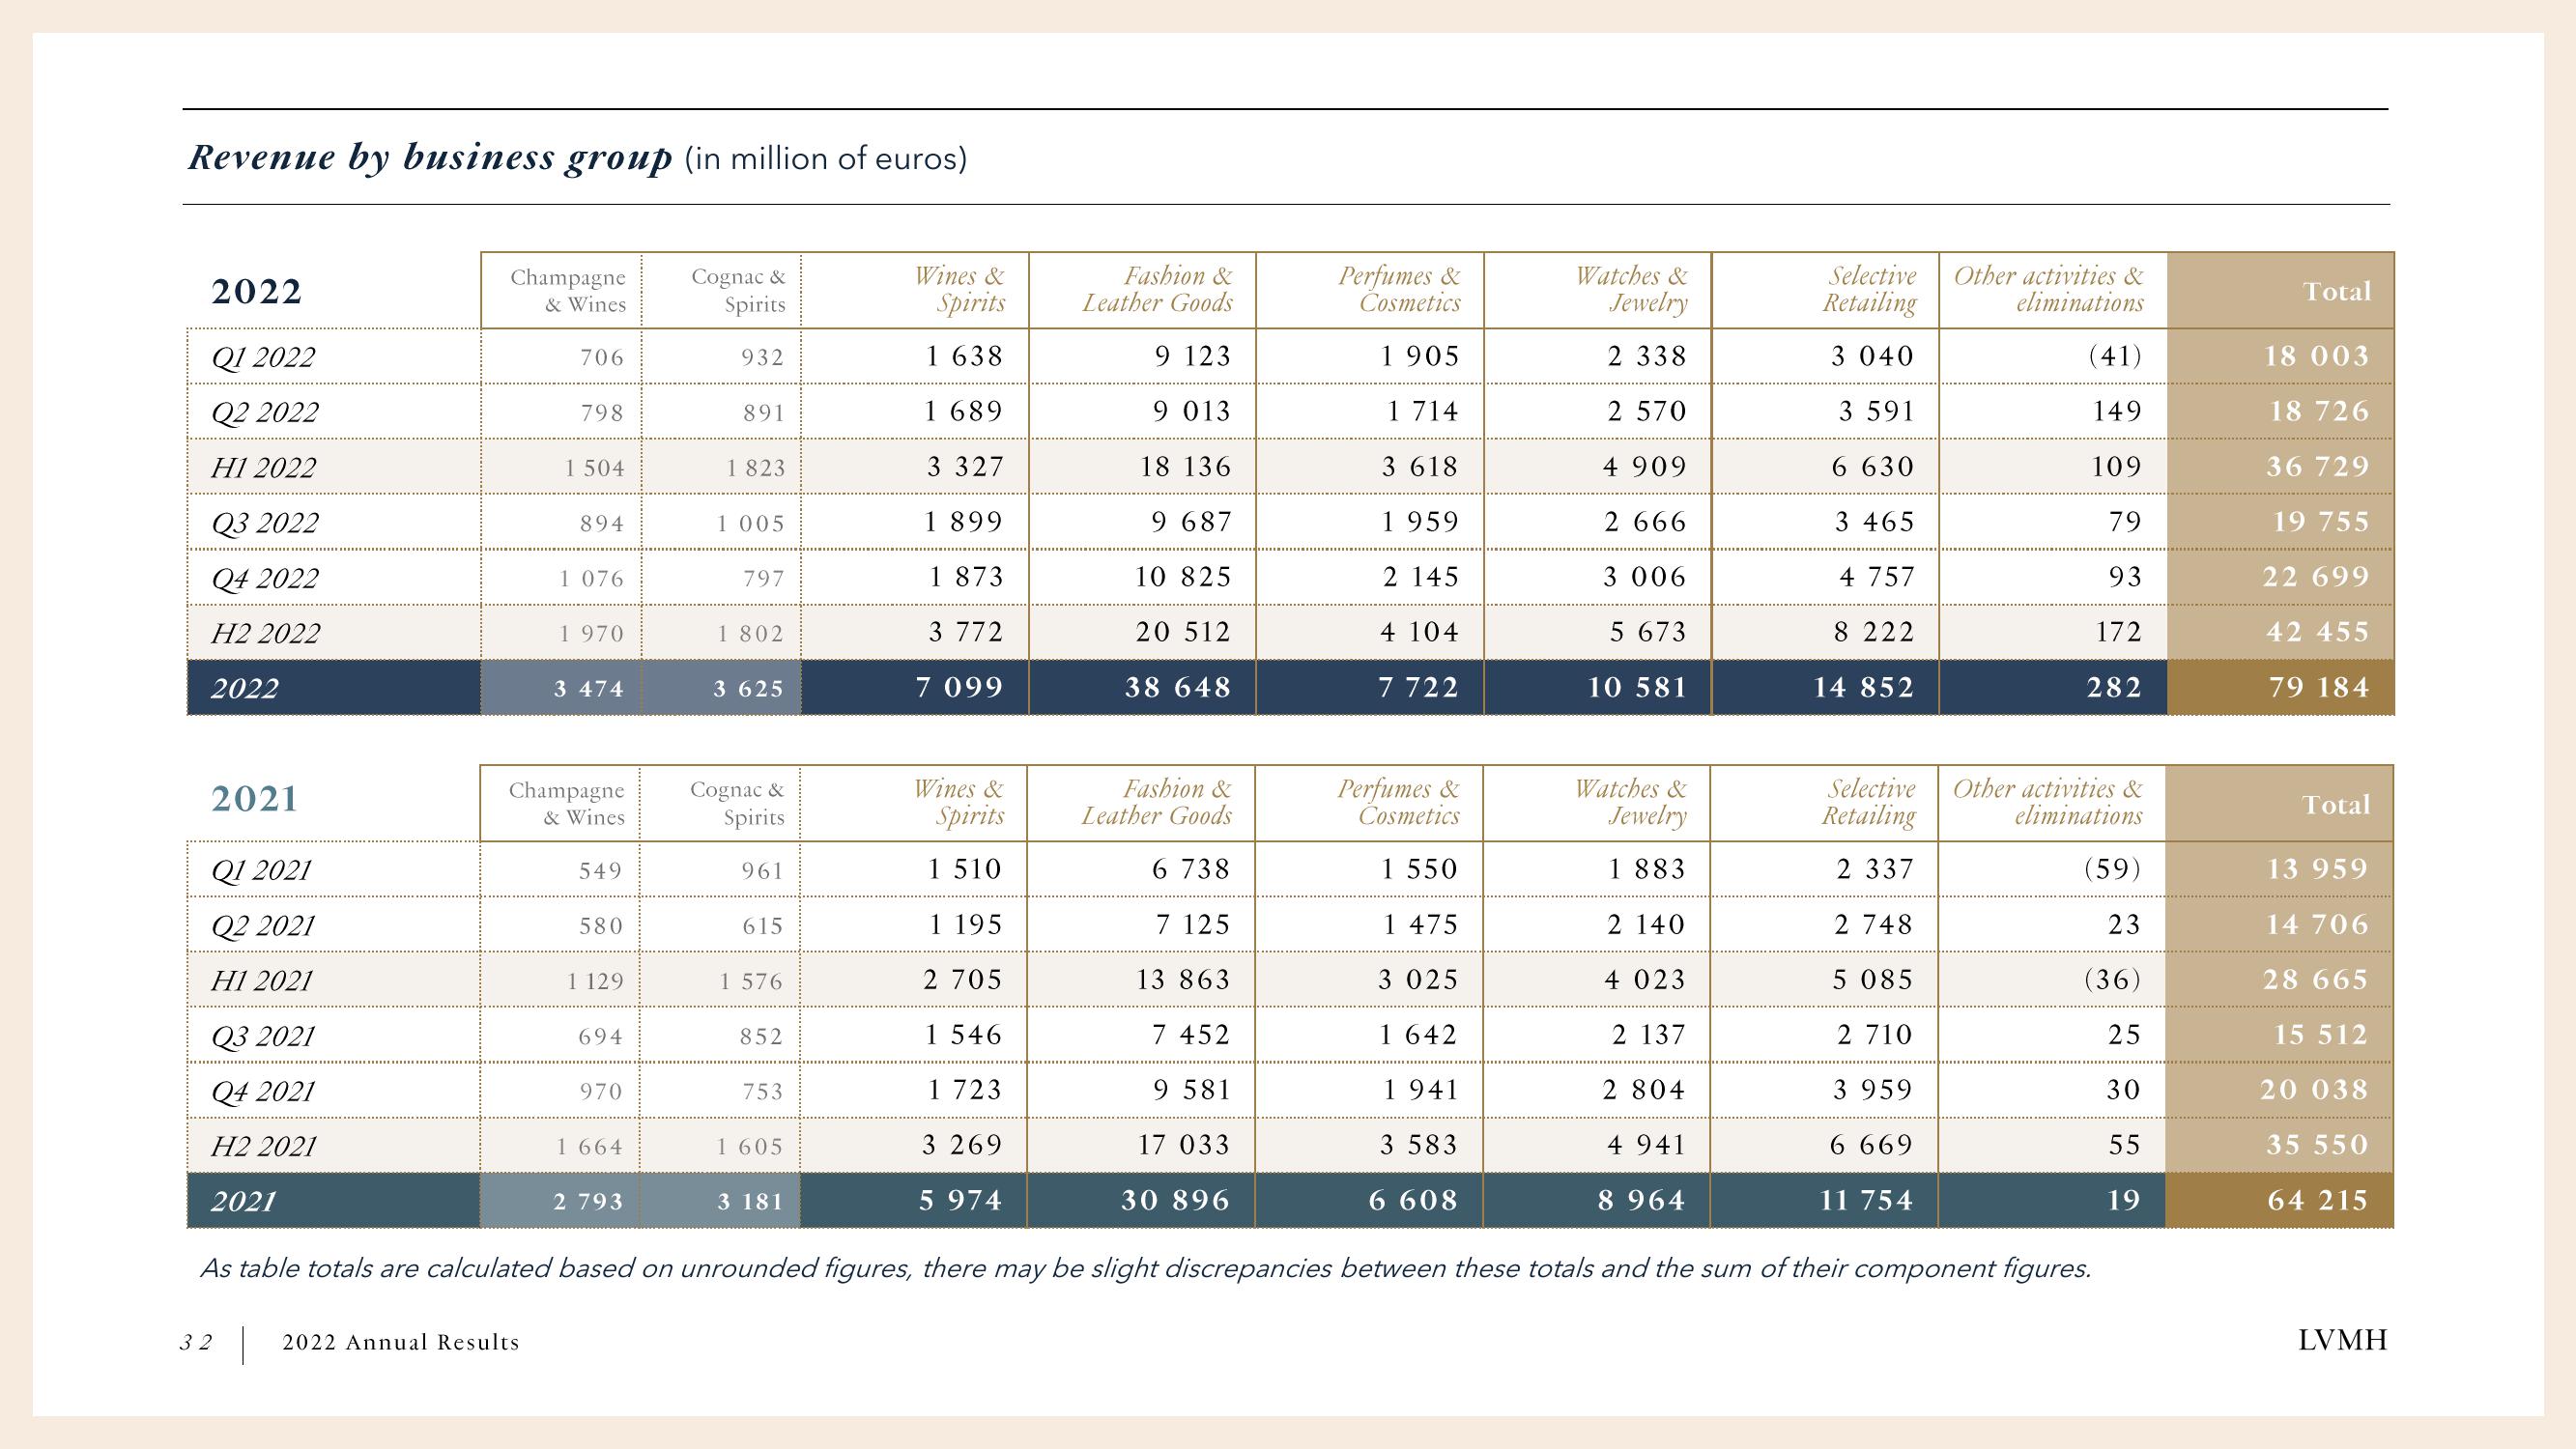
Revenue by business group (in million of euros)
2022
Q1 2022
Q2 2022
H1 2022
Q3 2022
Q4 2022
H2 2022
2022
2021
Q1 2021
Q2 2021
H1 2021
Q3 2021
Q4 2021
H2 2021
2021
Champagne
& Wines
706
798
1 504
32 2022 Annual Results
894
1 076
1 970
3 474
Champagne
& Wines
549
580
1 129
694
970
1 664
2 793
Cognac &
Spirits
932
891
1 823
1 005
797
1 802
3 625
Cognac &
Spirits
961
615
1 576
852
753
1 605
3 181
Wines &
Spirits
1 638
1 689
3 327
1 899
1 873
3 772
7 099
Wines &
Spirits
1 510
1 195
2 705
1 546
1 723
3 269
5 974
Fashion &
Leather Goods
9 123
9 013
18 136
9 687
10 825
20 512
38 648
Fashion &
Leather Goods
6 738
7 125
13 863
7 452
9 581
17 033
30 896
Perfumes &
Cosmetics
1 905
1 714
3 618
1 959
2 145
4 104
7 722
Perfumes &
Cosmetics
1 550
1 475
3 025
1 642
1941
3 583
6 608
Watches &
Jewelry
2 338
2 570
4 909
2 666
3 006
5 673
10 581
Watches &
Jewelry
1 883
2 140
4 023
2 137
2 804
4 941
8 964
Selective
Retailing
3 040
3 591
6 630
3 465
4 757
8 222
14 852
Selective
Retailing
2 337
2 748
5 085
2 710
3 959
6 669
11 754
Other activities &
eliminations
(41)
149
109
79
93
172
282
Other activities &
eliminations
(59)
23
(36)
25
30
55
19
As table totals are calculated based on unrounded figures, there may be slight discrepancies between these totals and the sum of their component figures.
Total
18 003
18 726
36 729
19 755
22 699
42 455
79 184
Total
13 959
14 706
28 665
15 512
20 038
35 550
64 215
LVMHView entire presentation