Silicon Valley Bank Results Presentation Deck
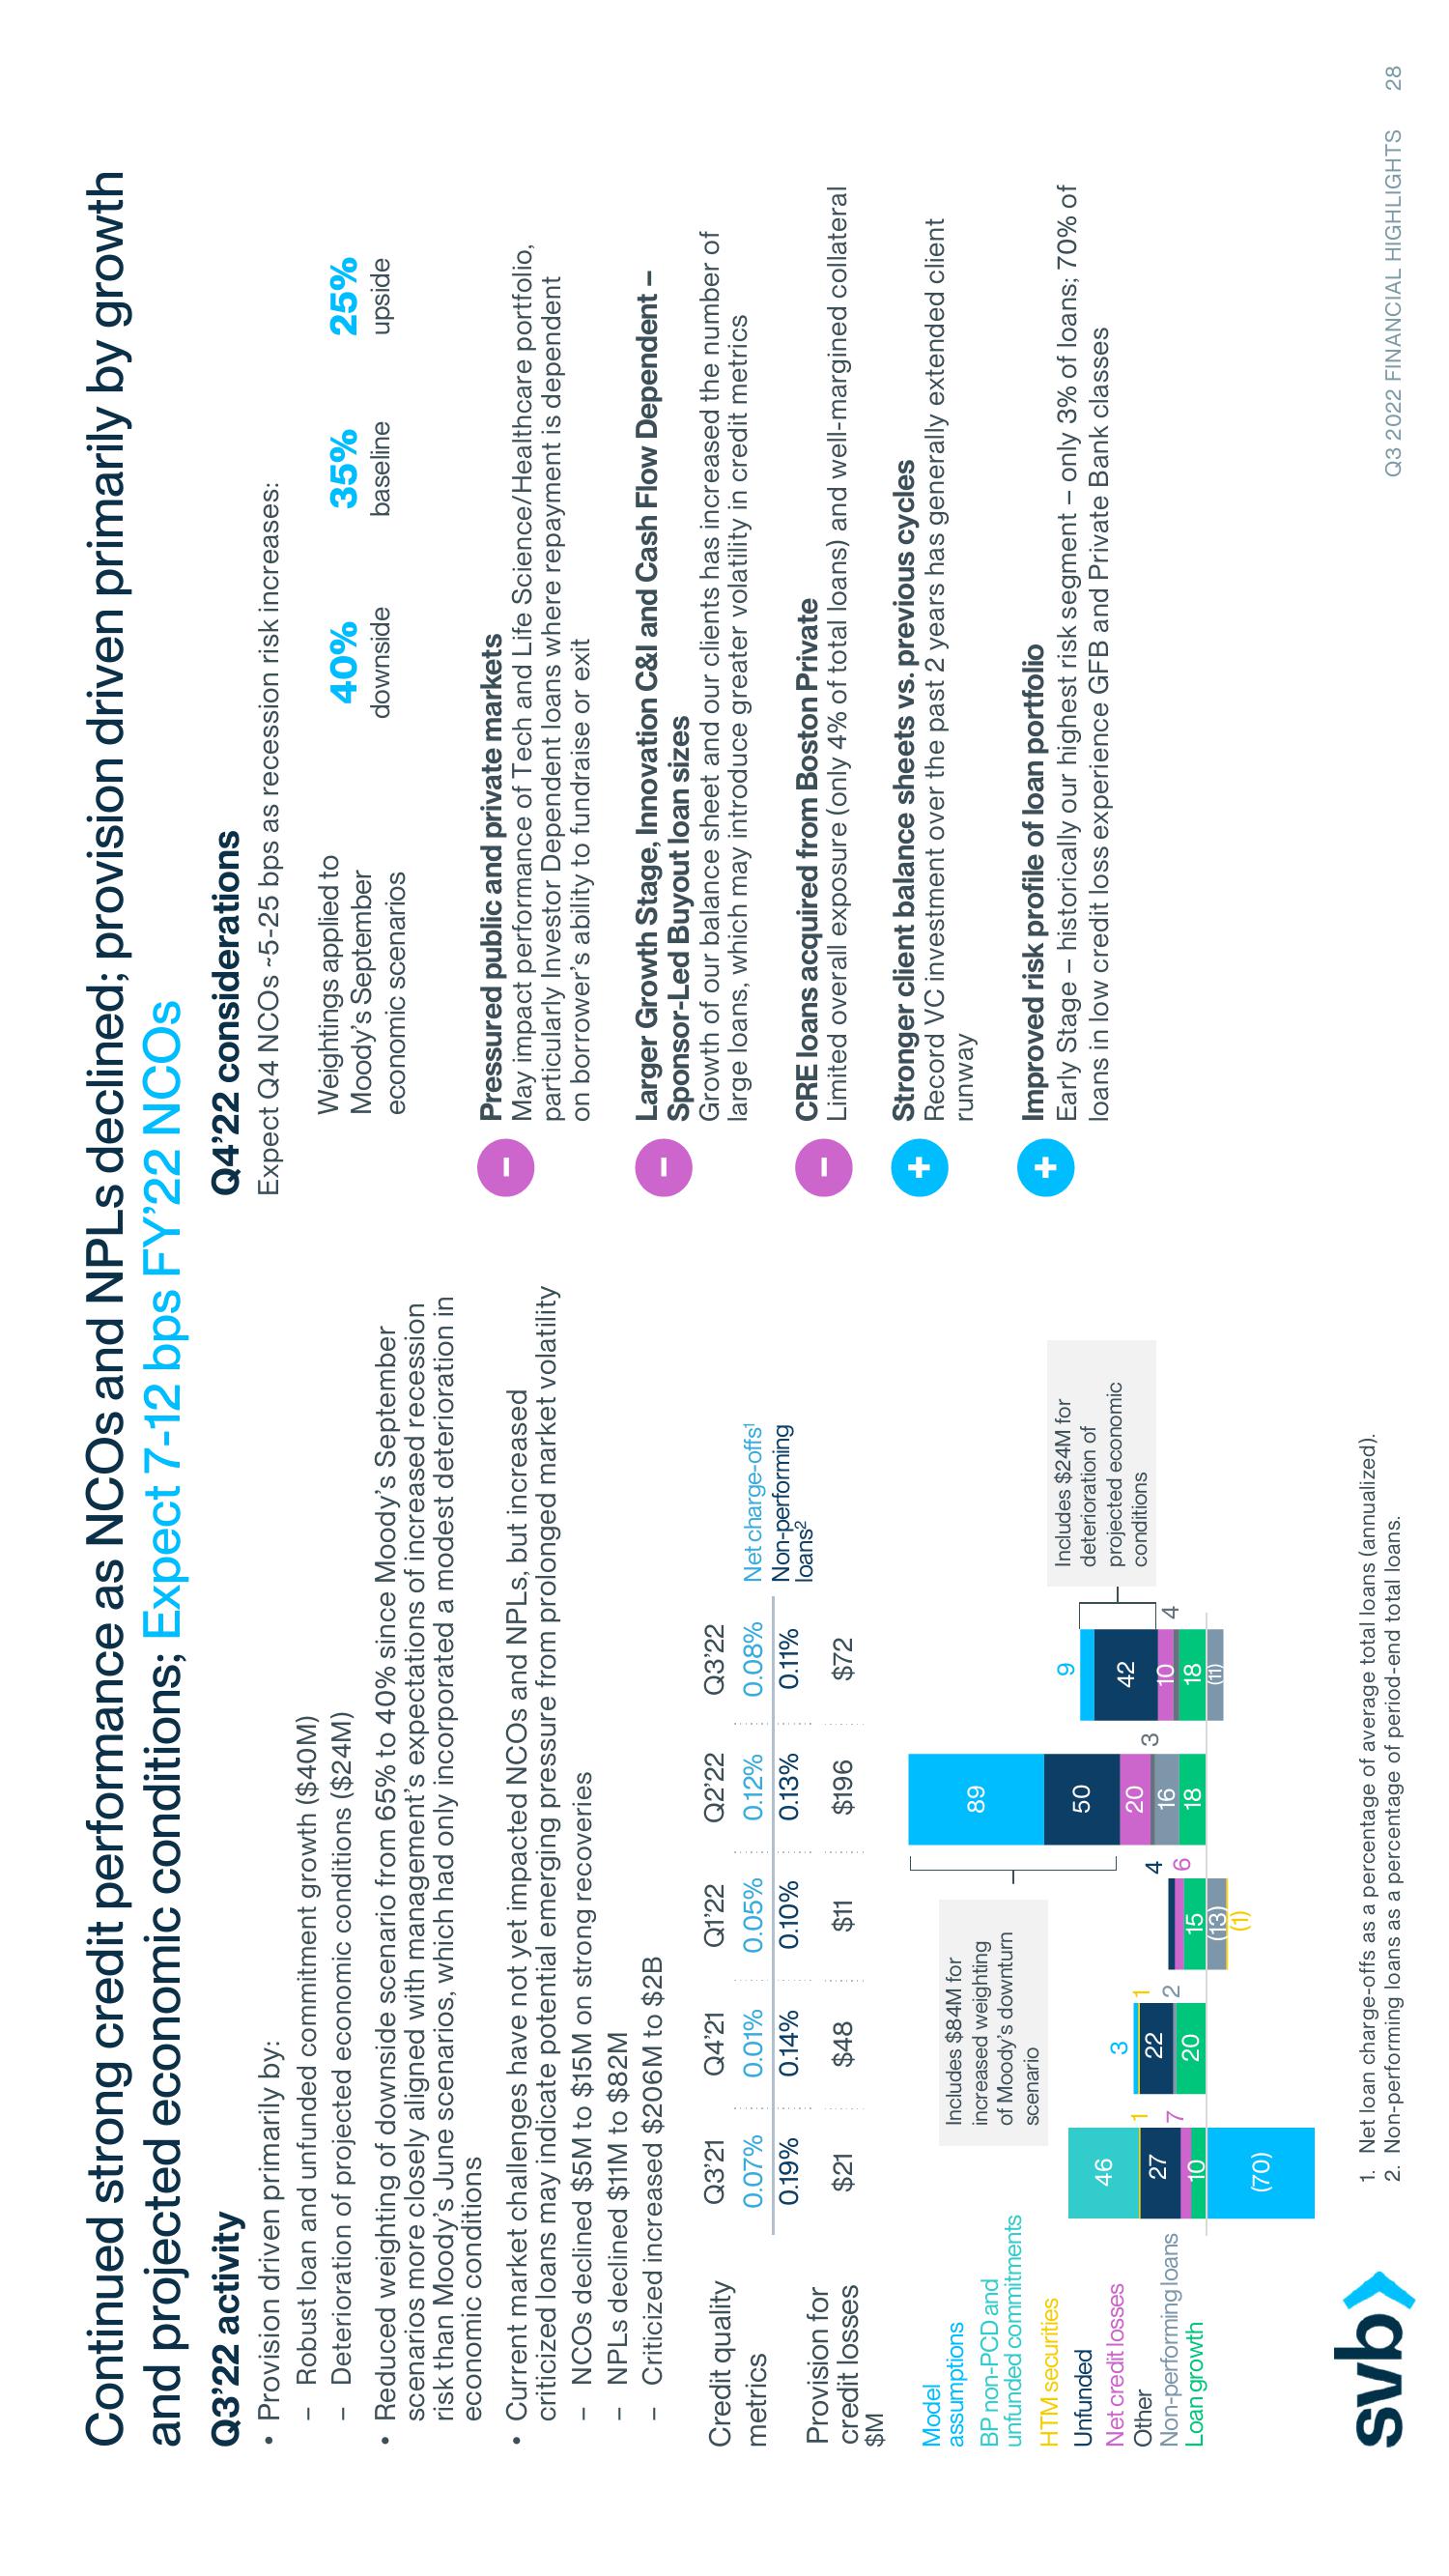
Continued strong credit performance as NCOs and NPLs declined; provision driven primarily by growth
and projected economic conditions; Expect 7-12 bps FY'22 NCOS
Q3'22 activity
Provision driven primarily by:
Robust loan and unfunded commitment growth ($40M)
Deterioration of projected economic conditions ($24M)
●
-
-
Reduced weighting of downside scenario from 65% to 40% since Moody's September
scenarios more closely aligned with management's expectations of increased recession
risk than Moody's June scenarios, which had only incorporated a modest deterioration in
economic conditions
Current market challenges have not yet impacted NCOS and NPLs, but increased
criticized loans may indicate potential emerging pressure from prolonged market volatility
NCOS declined $5M to $15M on strong recoveries
NPLs declined $11M to $82M
Criticized increased $206M to $2B
Credit quality
metrics
Provision for
credit losses
$M
Model
assumptions
BP non-PCD and
unfunded commitments
HTM securities
Unfunded
Net credit losses
Other
Non-performing loans
Loan growth
svb>
Q3'21
0.07%
0.19%
$21
46
27
10
(70)
Q4'21
0.01%
0.14%
$48
Includes $84M for
increased weighting
of Moody's downturn
scenario
3
22
20
Q1'22
0.05%
0.10%
$11
2
15
(13)
(1)
96
4
Q2'22 Q3'22
0.12%
0.08%
0.13%
0.11%
$196
$72
89
50
20
16
18
3
9
42
10
18
(11)
4
Net charge-offs¹
Non-performing
loans²
Includes $24M for
deterioration of
projected economic
conditions
1. Net loan charge-offs as a percentage of average total loans (annualized).
2. Non-performing loans as a percentage of period-end total loans.
Q4'22 considerations
Expect Q4 NCOS ~5-25 bps as recession risk increases:
Weightings applied to
Moody's September
economic scenarios
40%
downside
35%
baseline
25%
upside
Pressured public and private markets
May impact performance of Tech and Life Science/Healthcare portfolio,
particularly Investor Dependent loans where repayment is dependent
on borrower's ability to fundraise or exit
Larger Growth Stage, Innovation C&I and Cash Flow Dependent -
Sponsor-Led Buyout loan sizes
Growth of our balance sheet and our clients has increased the number of
large loans, which may introduce greater volatility in credit metrics
CRE loans acquired from Boston Private
Limited overall exposure (only 4% of total loans) and well-margined collateral
Stronger client balance sheets vs. previous cycles
Record VC investment over the past 2 years has generally extended client
runway
Improved risk profile of loan portfolio
Early Stage - historically our highest risk segment only 3% of loans; 70% of
loans in low credit loss experience GFB and Private Bank classes
Q3 2022 FINANCIAL HIGHLIGHTS 28View entire presentation