Bed Bath & Beyond Results Presentation Deck
Non-GAAP
Reconciliation*
(in thousands, except per share
data)
(unaudited)
14
Reconciliation of Adjusted Gross Profit
Reported gross profit
Adjustments:
Inventory write down
Total adjustments
Adjusted gross profit
Reconciliation of Adjusted Gross Margin
Reported gross margin
Adjustments:
Inventory write down
Total adjustments
Adjusted gross margin
Reconciliation of Adjusted Selling, General and Administrative Expenses
Reported selling, general and administrative expenses
Adjustments:
Severance costs
Shareholder activity costs
Total adjustments
Adjusted selling, general and administrative expenses
Three Months Ended
August 31, September 1,
2019
2018
$ 726,988 $
$
193,735
193,735
920,723
26.7%
7.2%
7.2%
33.9%
880,889
(22,537)
(22,537)
858,352
988,561
$ 988,561
33.7%
0.0%
0.0%
33.7%
(4,559)
(4,559)
$ 905,144
Six Months Ended
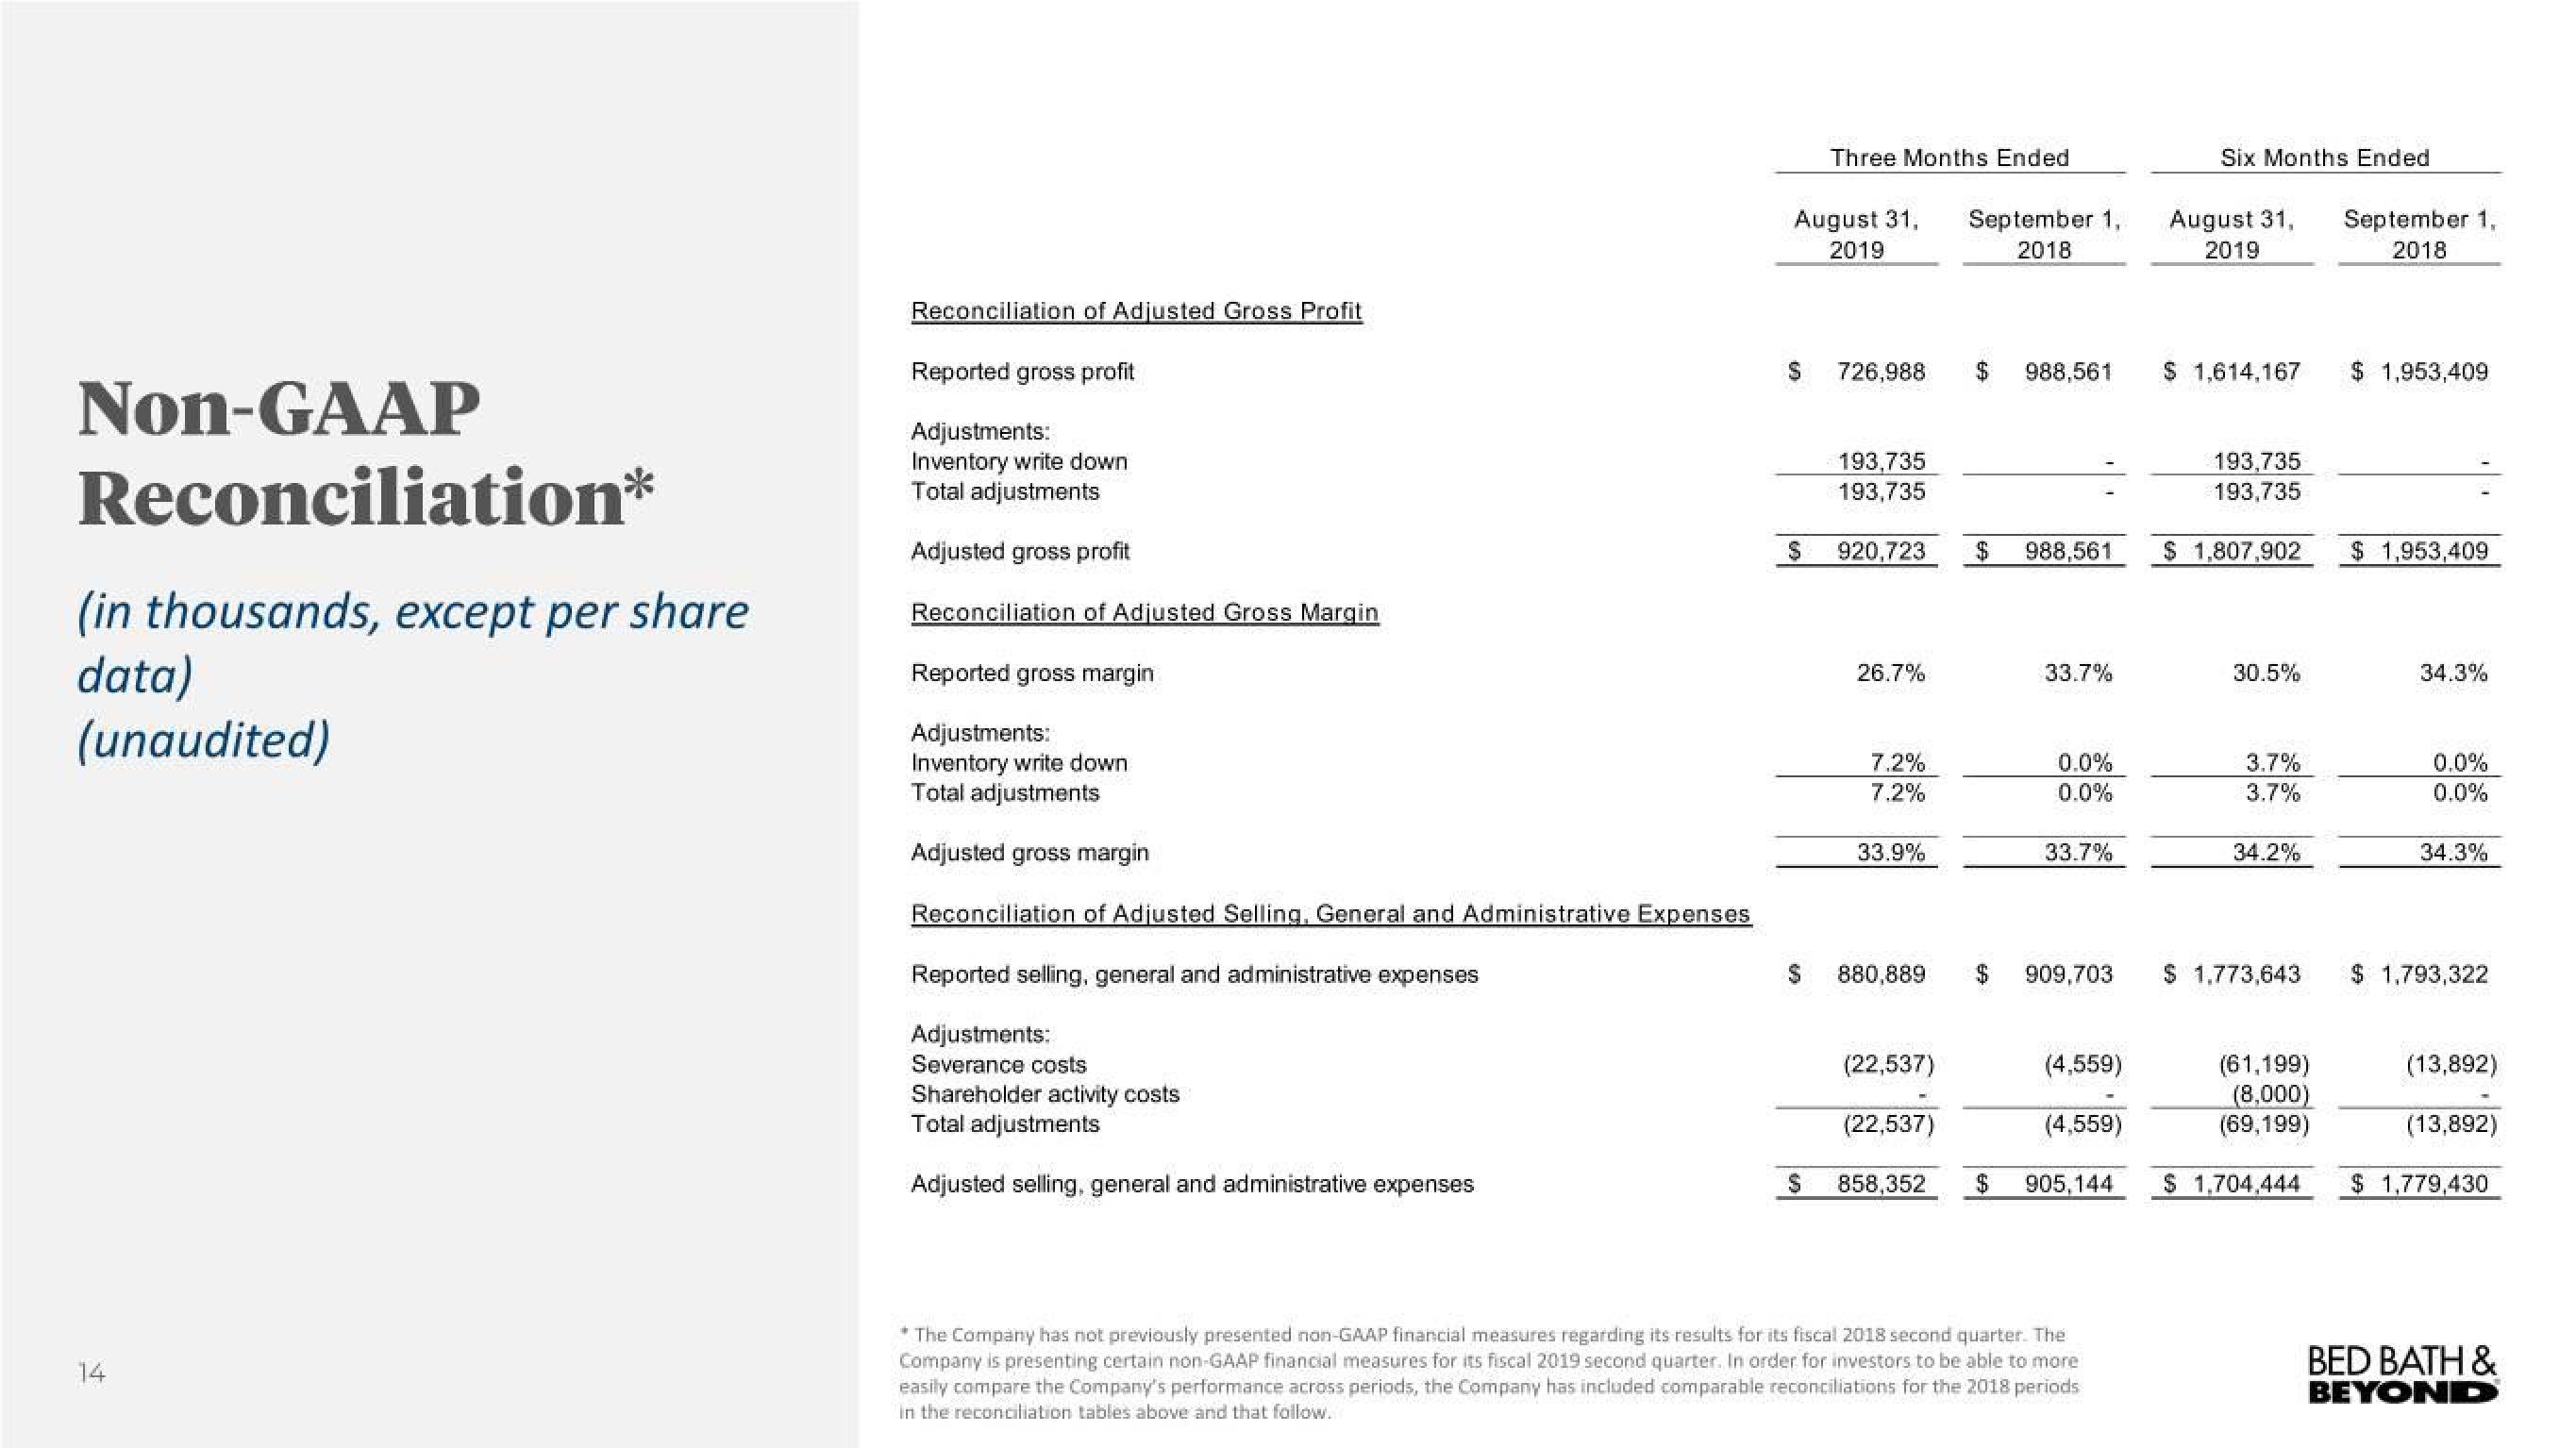
* The Company has not previously presented non-GAAP financial measures regarding its results for its fiscal 2018 second quarter. The
Company is presenting certain non-GAAP financial measures for its fiscal 2019 second quarter. In order for investors to be able to more
easily compare the Company's performance across periods, the Company has included comparable reconciliations for the 2018 periods
in the reconciliation tables above and that follow..
August 31, September 1,
2019
2018
$ 1,614,167
193,735
193,735
$ 1,807,902
30.5%
3.7%
3.7%
$ 909,703 $ 1,773,643
34.2%
(61,199)
(8,000)
(69,199)
$ 1,704,444
$ 1,953,409
$ 1,953,409
34.3%
0.0%
0.0%
34.3%
$ 1,793,322
(13,892)
(13,892)
$ 1,779,430
BED BATH &
BEYONDView entire presentation