Spring 2023 Solar Industry Update
600
500
Annual Global PV Demand
•
.
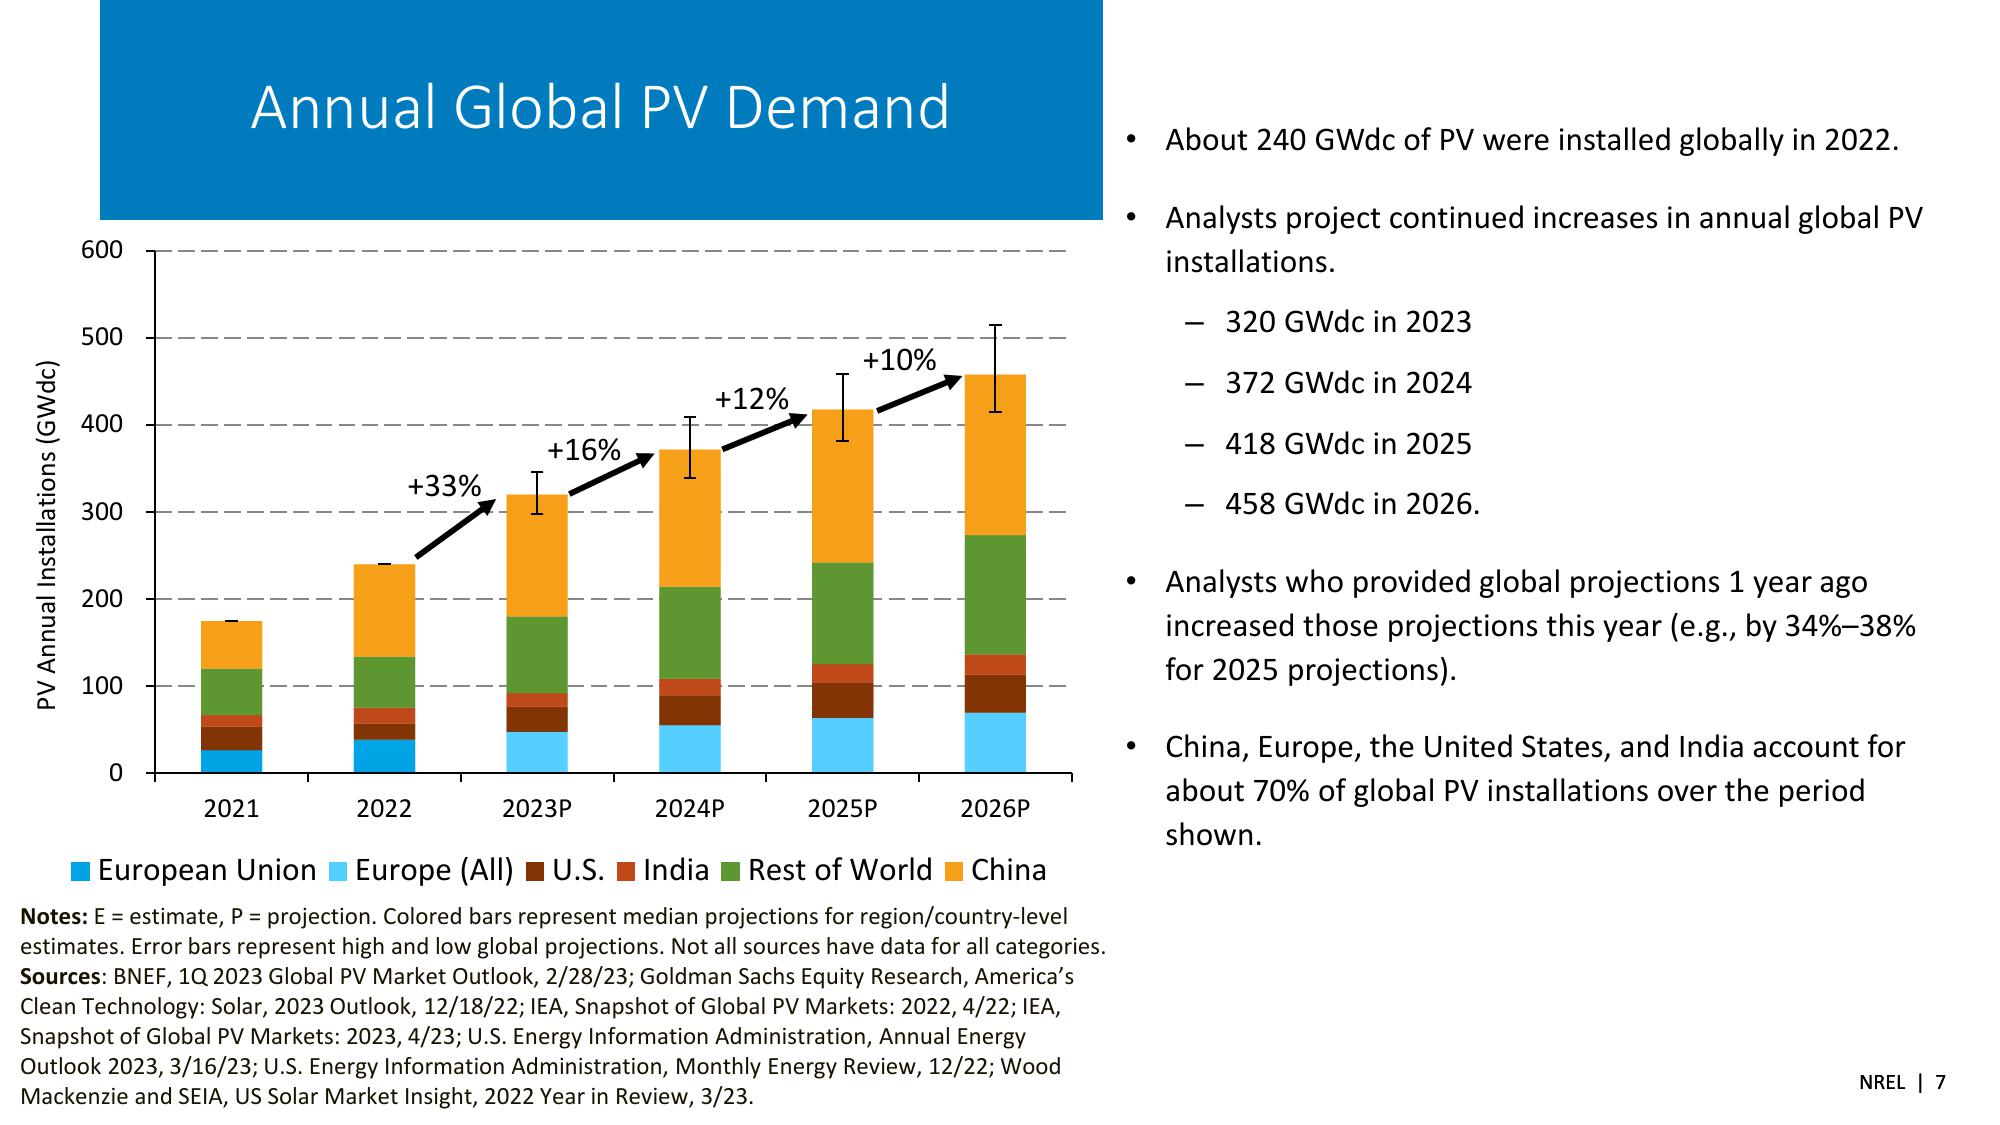
About 240 GWdc of PV were installed globally in 2022.
Analysts project continued increases in annual global PV
installations.
320 GWdc in 2023
PV Annual Installations (GWdc)
400
300
200
100
0
2021
European Union
2022
+10%
+12%
+16%
+33%
2023P
2024P
2025P
2026P
Europe (All) ■U.S. India Rest of World China
Notes: E = estimate, P = projection. Colored bars represent median projections for region/country-level
estimates. Error bars represent high and low global projections. Not all sources have data for all categories.
Sources: BNEF, 1Q 2023 Global PV Market Outlook, 2/28/23; Goldman Sachs Equity Research, America's
Clean Technology: Solar, 2023 Outlook, 12/18/22; IEA, Snapshot of Global PV Markets: 2022, 4/22; IEA,
Snapshot of Global PV Markets: 2023, 4/23; U.S. Energy Information Administration, Annual Energy
Outlook 2023, 3/16/23; U.S. Energy Information Administration, Monthly Energy Review, 12/22; Wood
Mackenzie and SEIA, US Solar Market Insight, 2022 Year in Review, 3/23.
•
-
372 GWdc in 2024
418 GWdc in 2025
458 GWdc in 2026.
Analysts who provided global projections 1 year ago
increased those projections this year (e.g., by 34%-38%
for 2025 projections).
China, Europe, the United States, and India account for
about 70% of global PV installations over the period
shown.
NREL | 7View entire presentation