Playboy SPAC Presentation Deck
PLAYBOY 2020
40
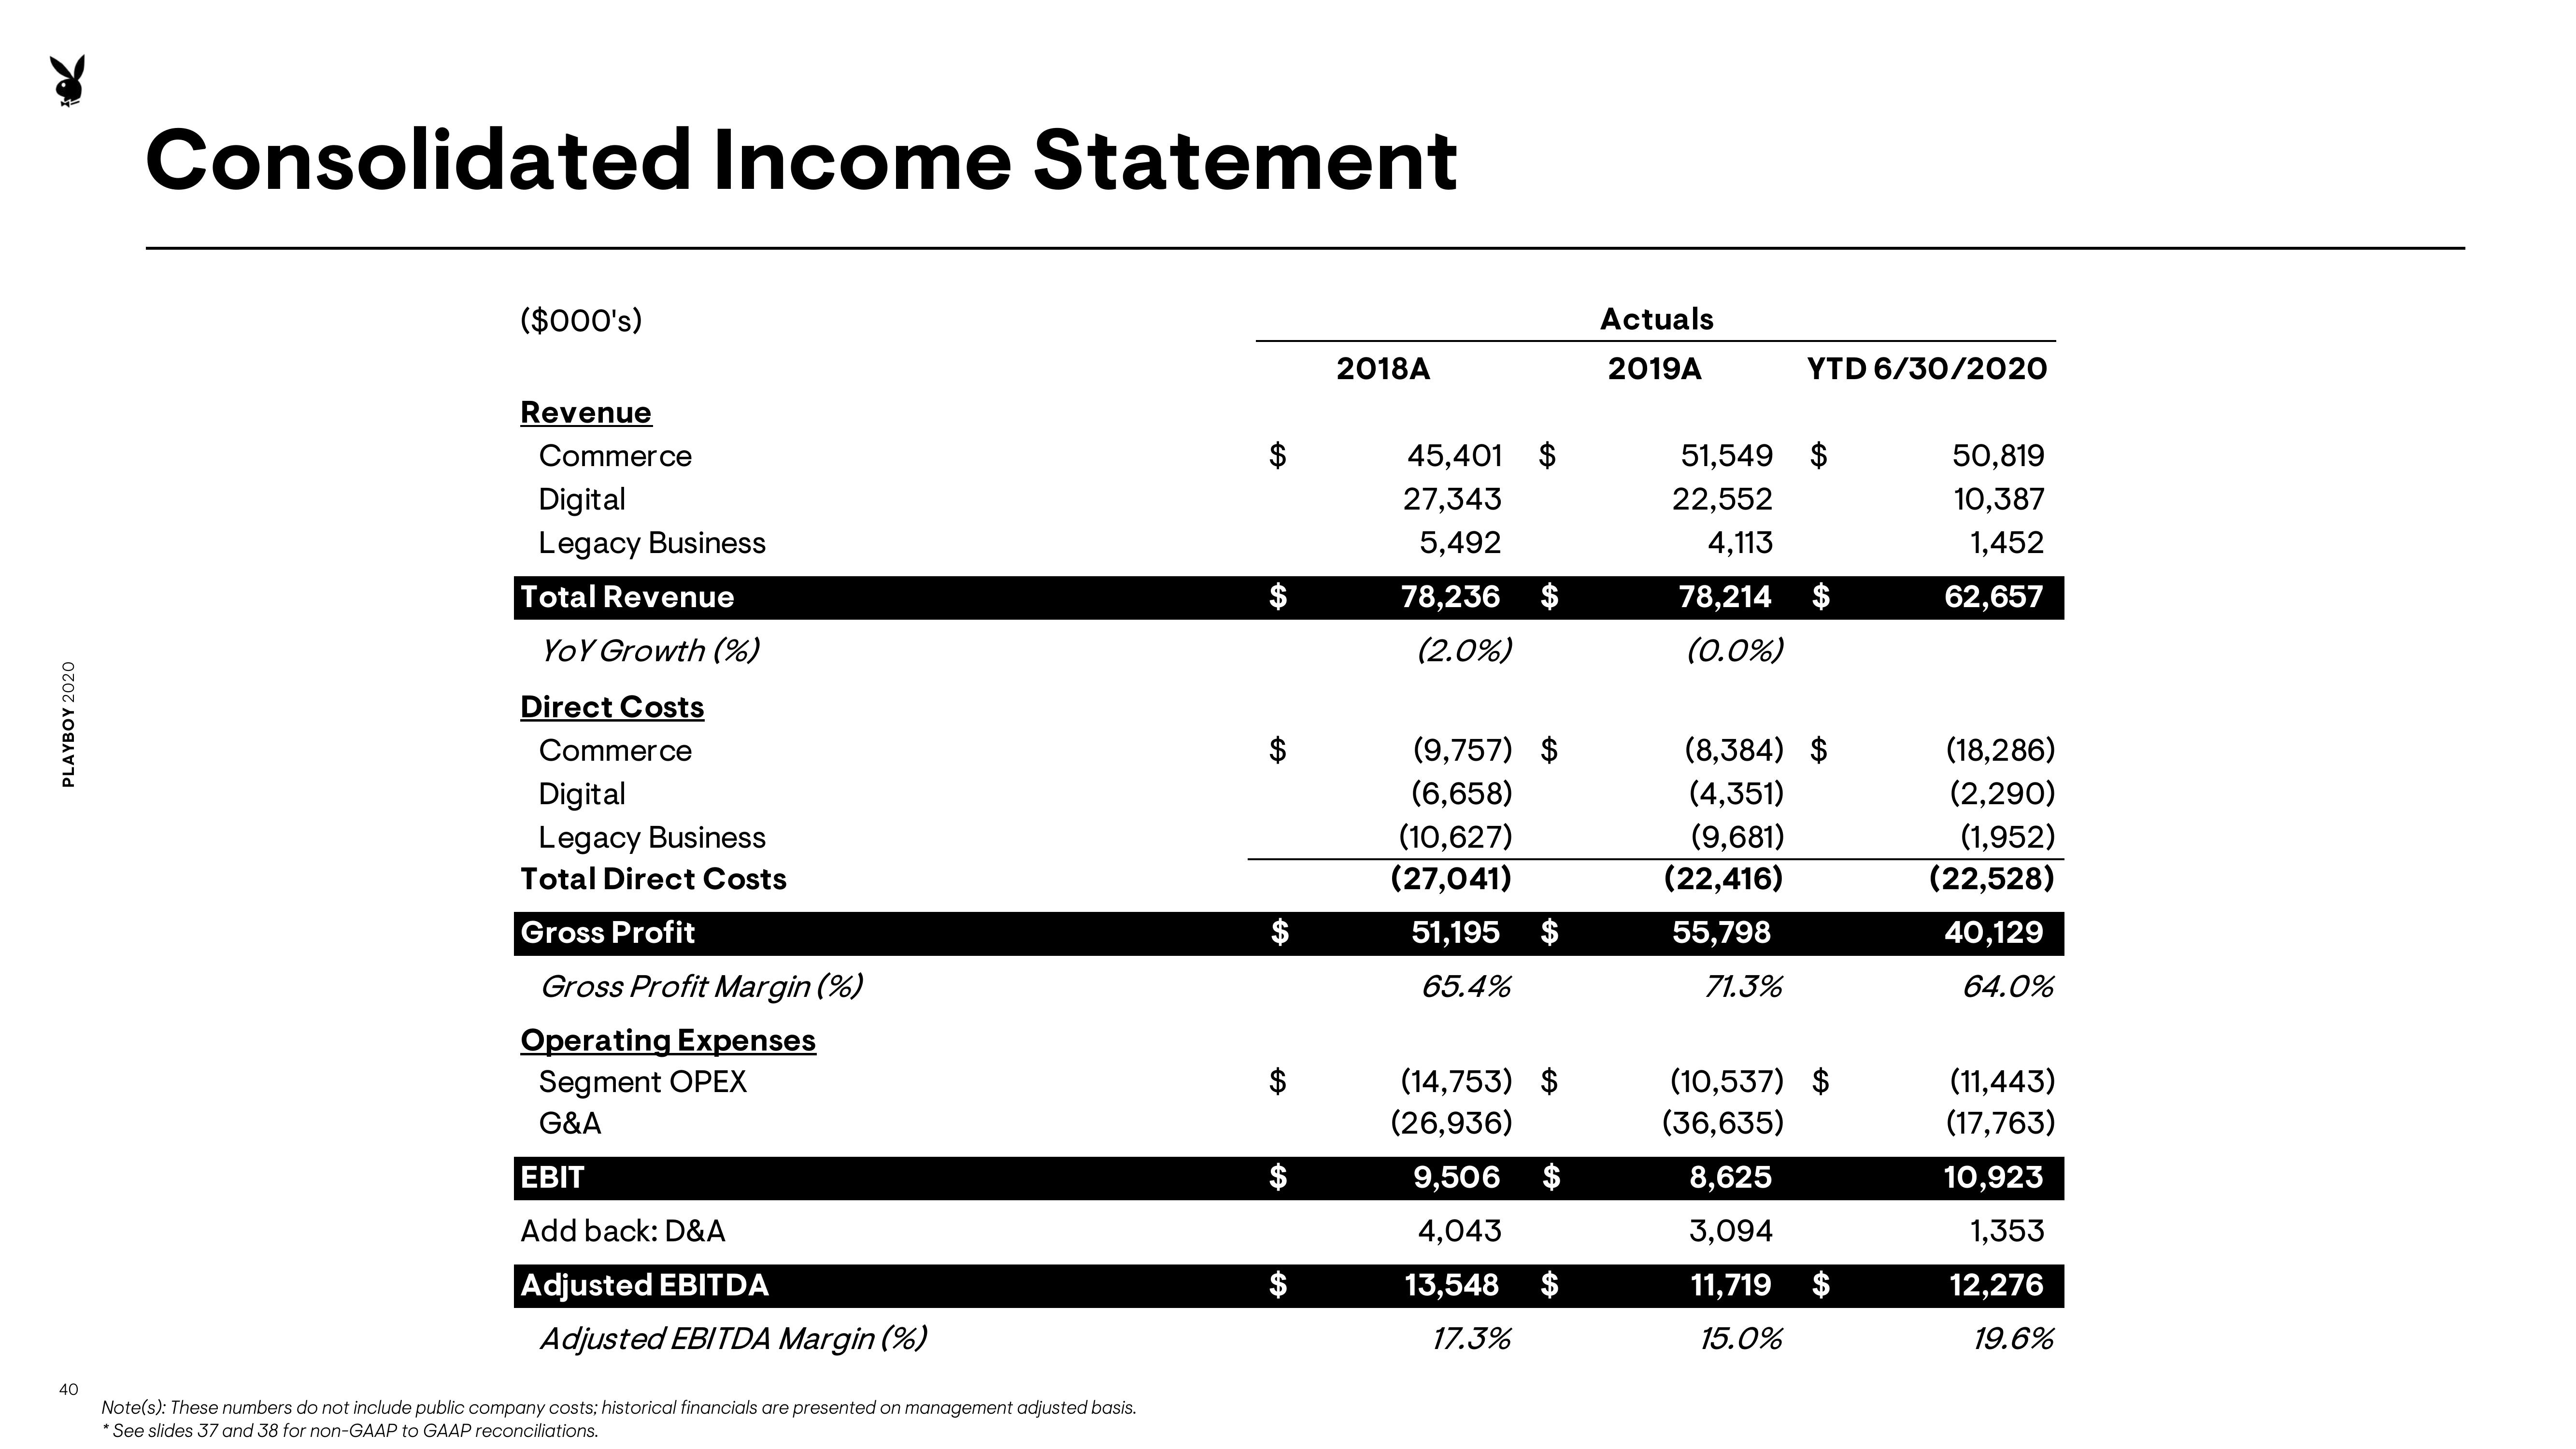
Consolidated Income Statement
($000's)
Revenue
Commerce
Digital
Legacy Business
Total Revenue
YOY Growth (%)
Direct Costs
Commerce
Digital
Legacy Business
Total Direct Costs
Gross Profit
Gross Profit Margin (%)
Operating Expenses
Segment OPEX
G&A
EBIT
Add back: D&A
Adjusted EBITDA
Adjusted EBITDA Margin (%)
Note(s): These numbers do not include public company costs; historical financials are presented on management adjusted basis.
* See slides 37 and 38 for non-GAAP to GAAP reconciliations.
2018A
45,401 $
27,343
5,492
78,236
(2.0%)
(9,757) $
(6,658)
(10,627)
(27,041)
51,195
65.4%
(14,753) $
(26,936)
9,506
4,043
13,548
17.3%
$
Actuals
2019A
YTD 6/30/2020
51,549
22,552
4,113
78,214 $
(0.0%)
$
71.3%
(8,384) $
(4,351)
(9,681)
(22,416)
55,798
(10,537) $
(36,635)
8,625
3,094
11,719
15.0%
$
50,819
10,387
1,452
62,657
(18,286)
(2,290)
(1,952)
(22,528)
40,129
64.0%
(11,443)
(17,763)
10,923
1,353
12,276
19.6%View entire presentation