Nikola Results Presentation Deck
NIKOLA.
PAGE/13
FINANCIAL RESULTS AT A GLANCE
$200,000
$150,000
$100,000
$50,000
$0
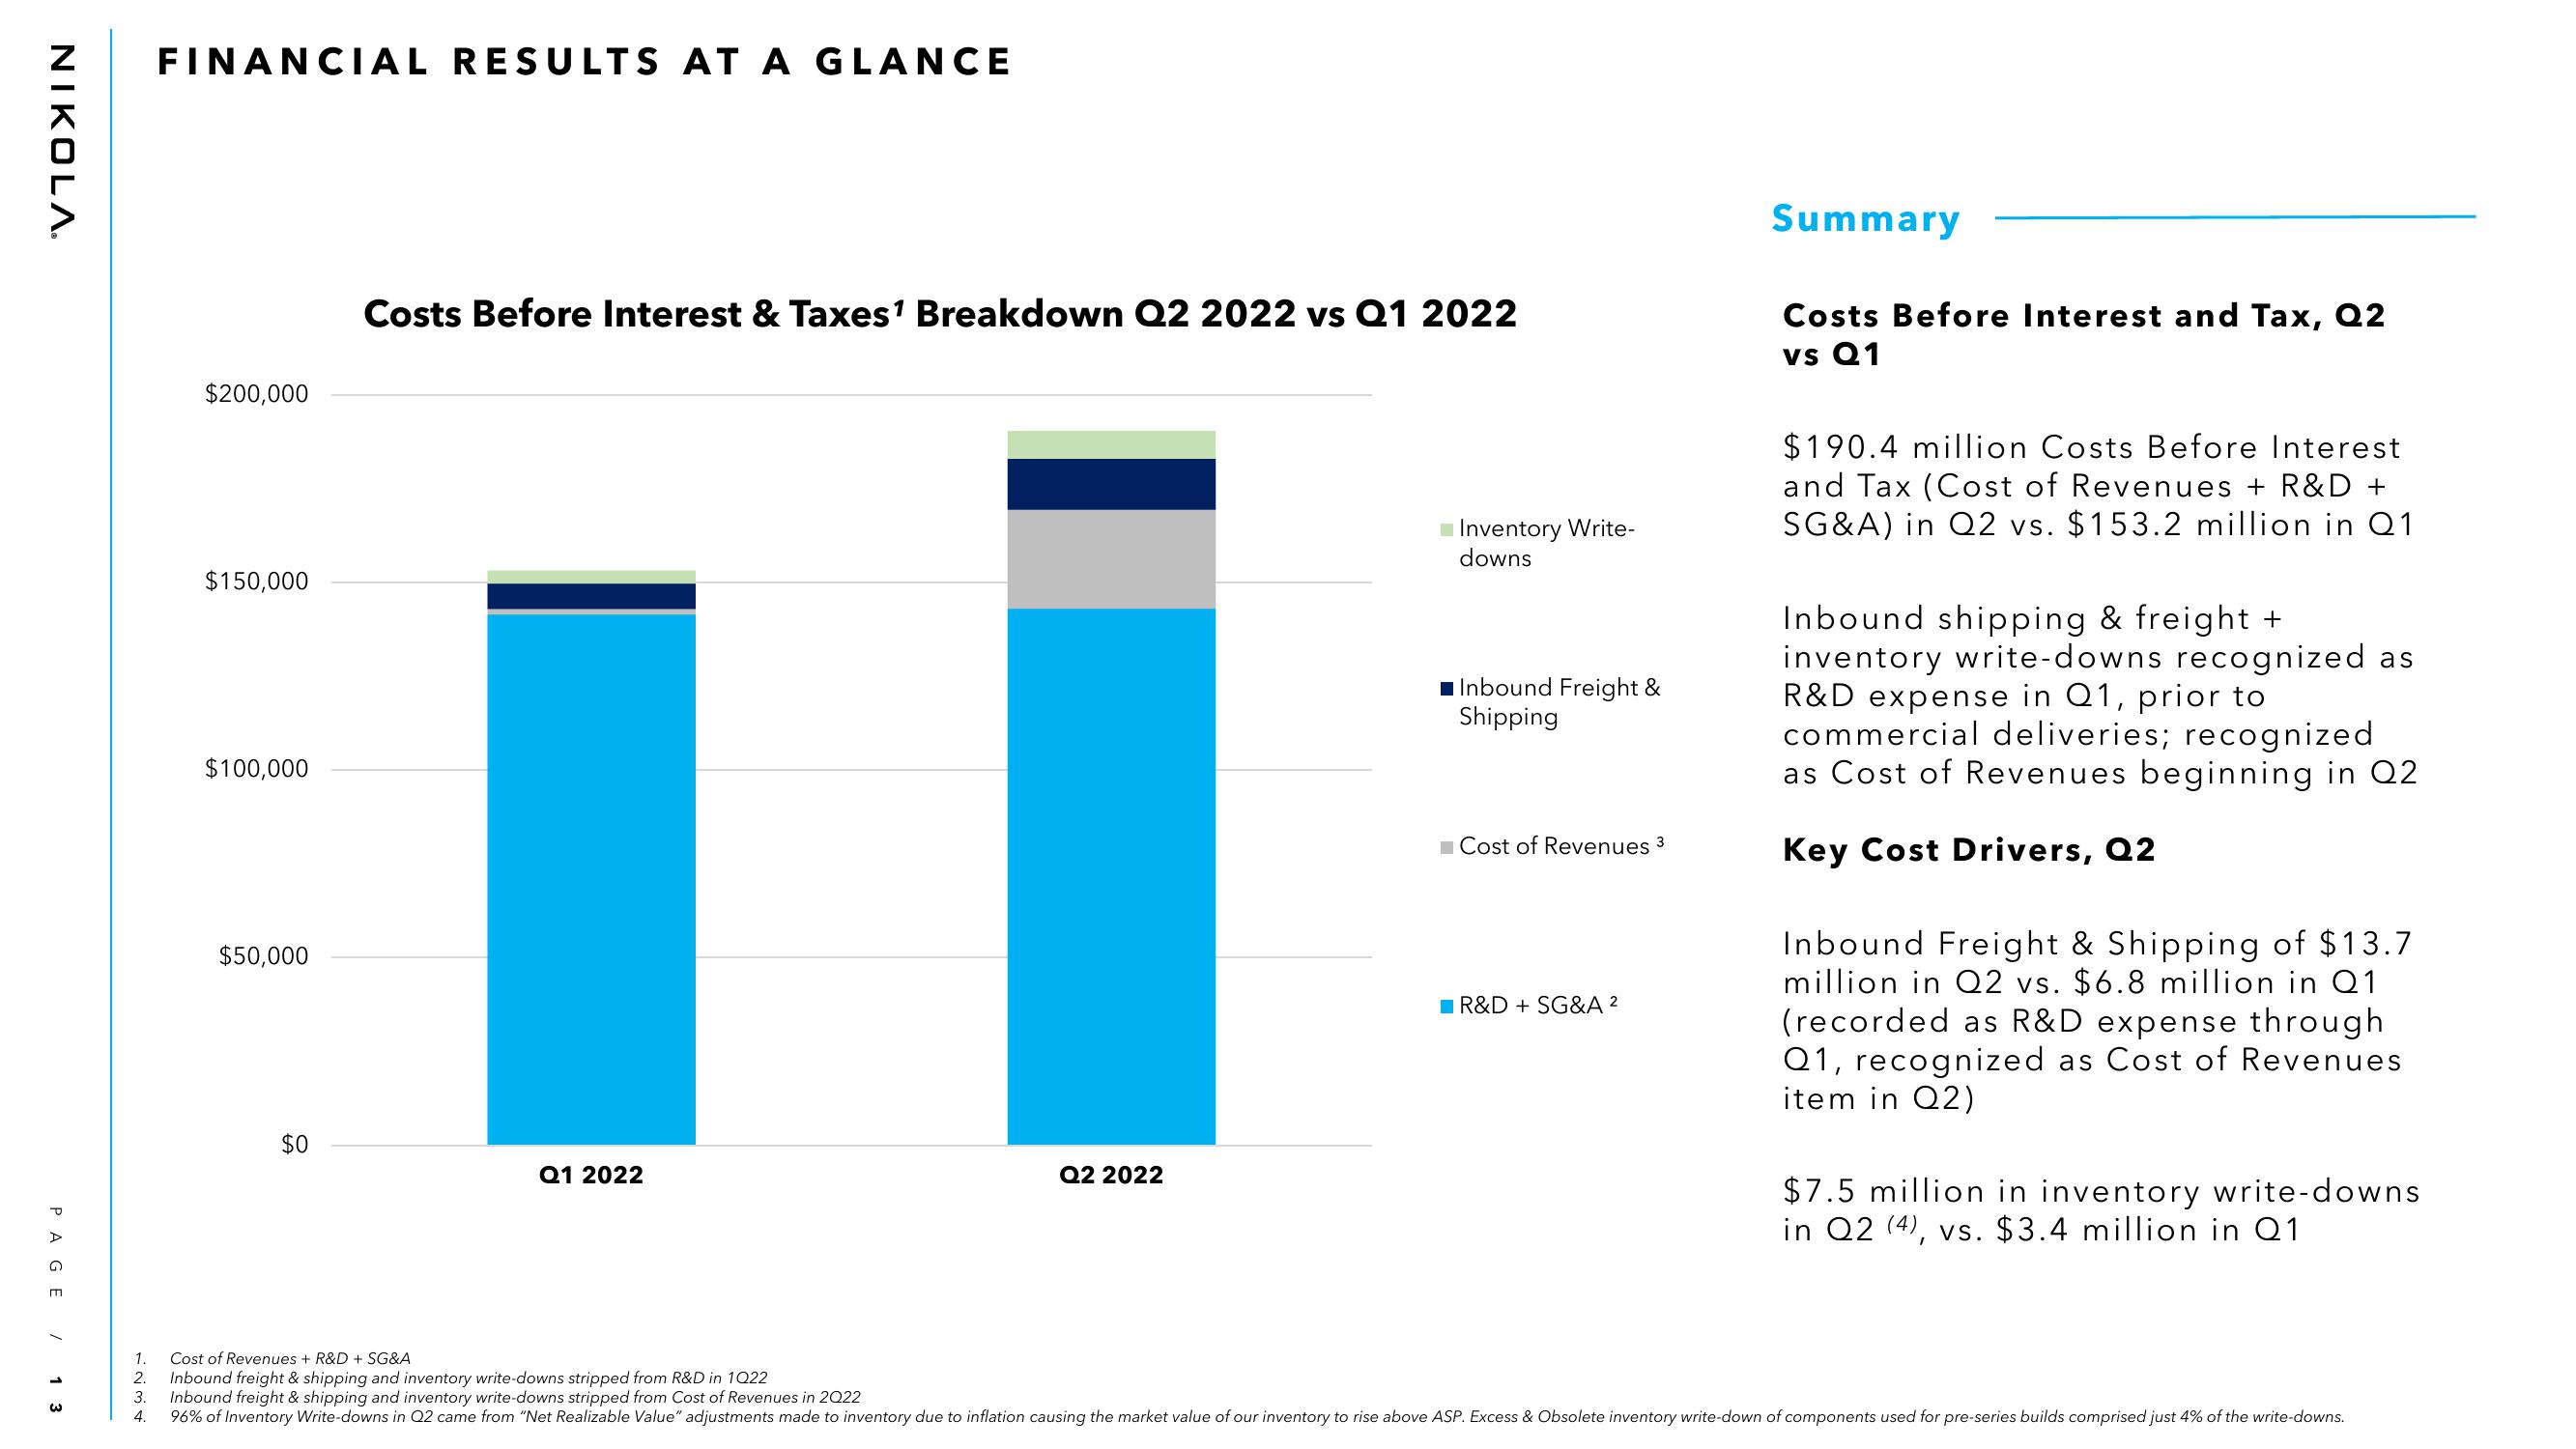
Costs Before Interest & Taxes¹ Breakdown Q2 2022 vs Q1 2022
Q1 2022
Q2 2022
Inventory Write-
downs
Inbound Freight &
Shipping
Cost of Revenues 3
R&D + SG&A ²
Summary
Costs Before Interest and Tax, Q2
vs Q1
$190.4 million Costs Before Interest
and Tax (Cost of Revenues + R&D +
SG&A) in Q2 vs. $153.2 million in Q1
Inbound shipping & freight +
inventory write-downs recognized as
R&D expense in Q1, prior to
commercial deliveries; recognized
as Cost of Revenues beginning in Q2
Key Cost Drivers, Q2
Inbound Freight & Shipping of $13.7
million in Q2 vs. $6.8 million in Q1
(recorded as R&D expense through
Q1, recognized as Cost of Revenues
item in Q2)
$7.5 million in inventory write-downs
in Q2 (4), vs. $3.4 million in Q1
1. Cost of Revenues + R&D + SG&A
2. Inbound freight & shipping and inventory write-downs stripped from R&D in 1Q22
3. Inbound freight & shipping and inventory write-downs stripped from Cost of Revenues in 2Q22
4. 96% of Inventory Write-downs in Q2 came from "Net Realizable Value" adjustments made to inventory due to inflation causing the market value of our inventory to rise above ASP. Excess & Obsolete inventory write-down of components used for pre-series builds comprised just 4% of the write-downs.View entire presentation