Endeavour Mining Investor Presentation Deck
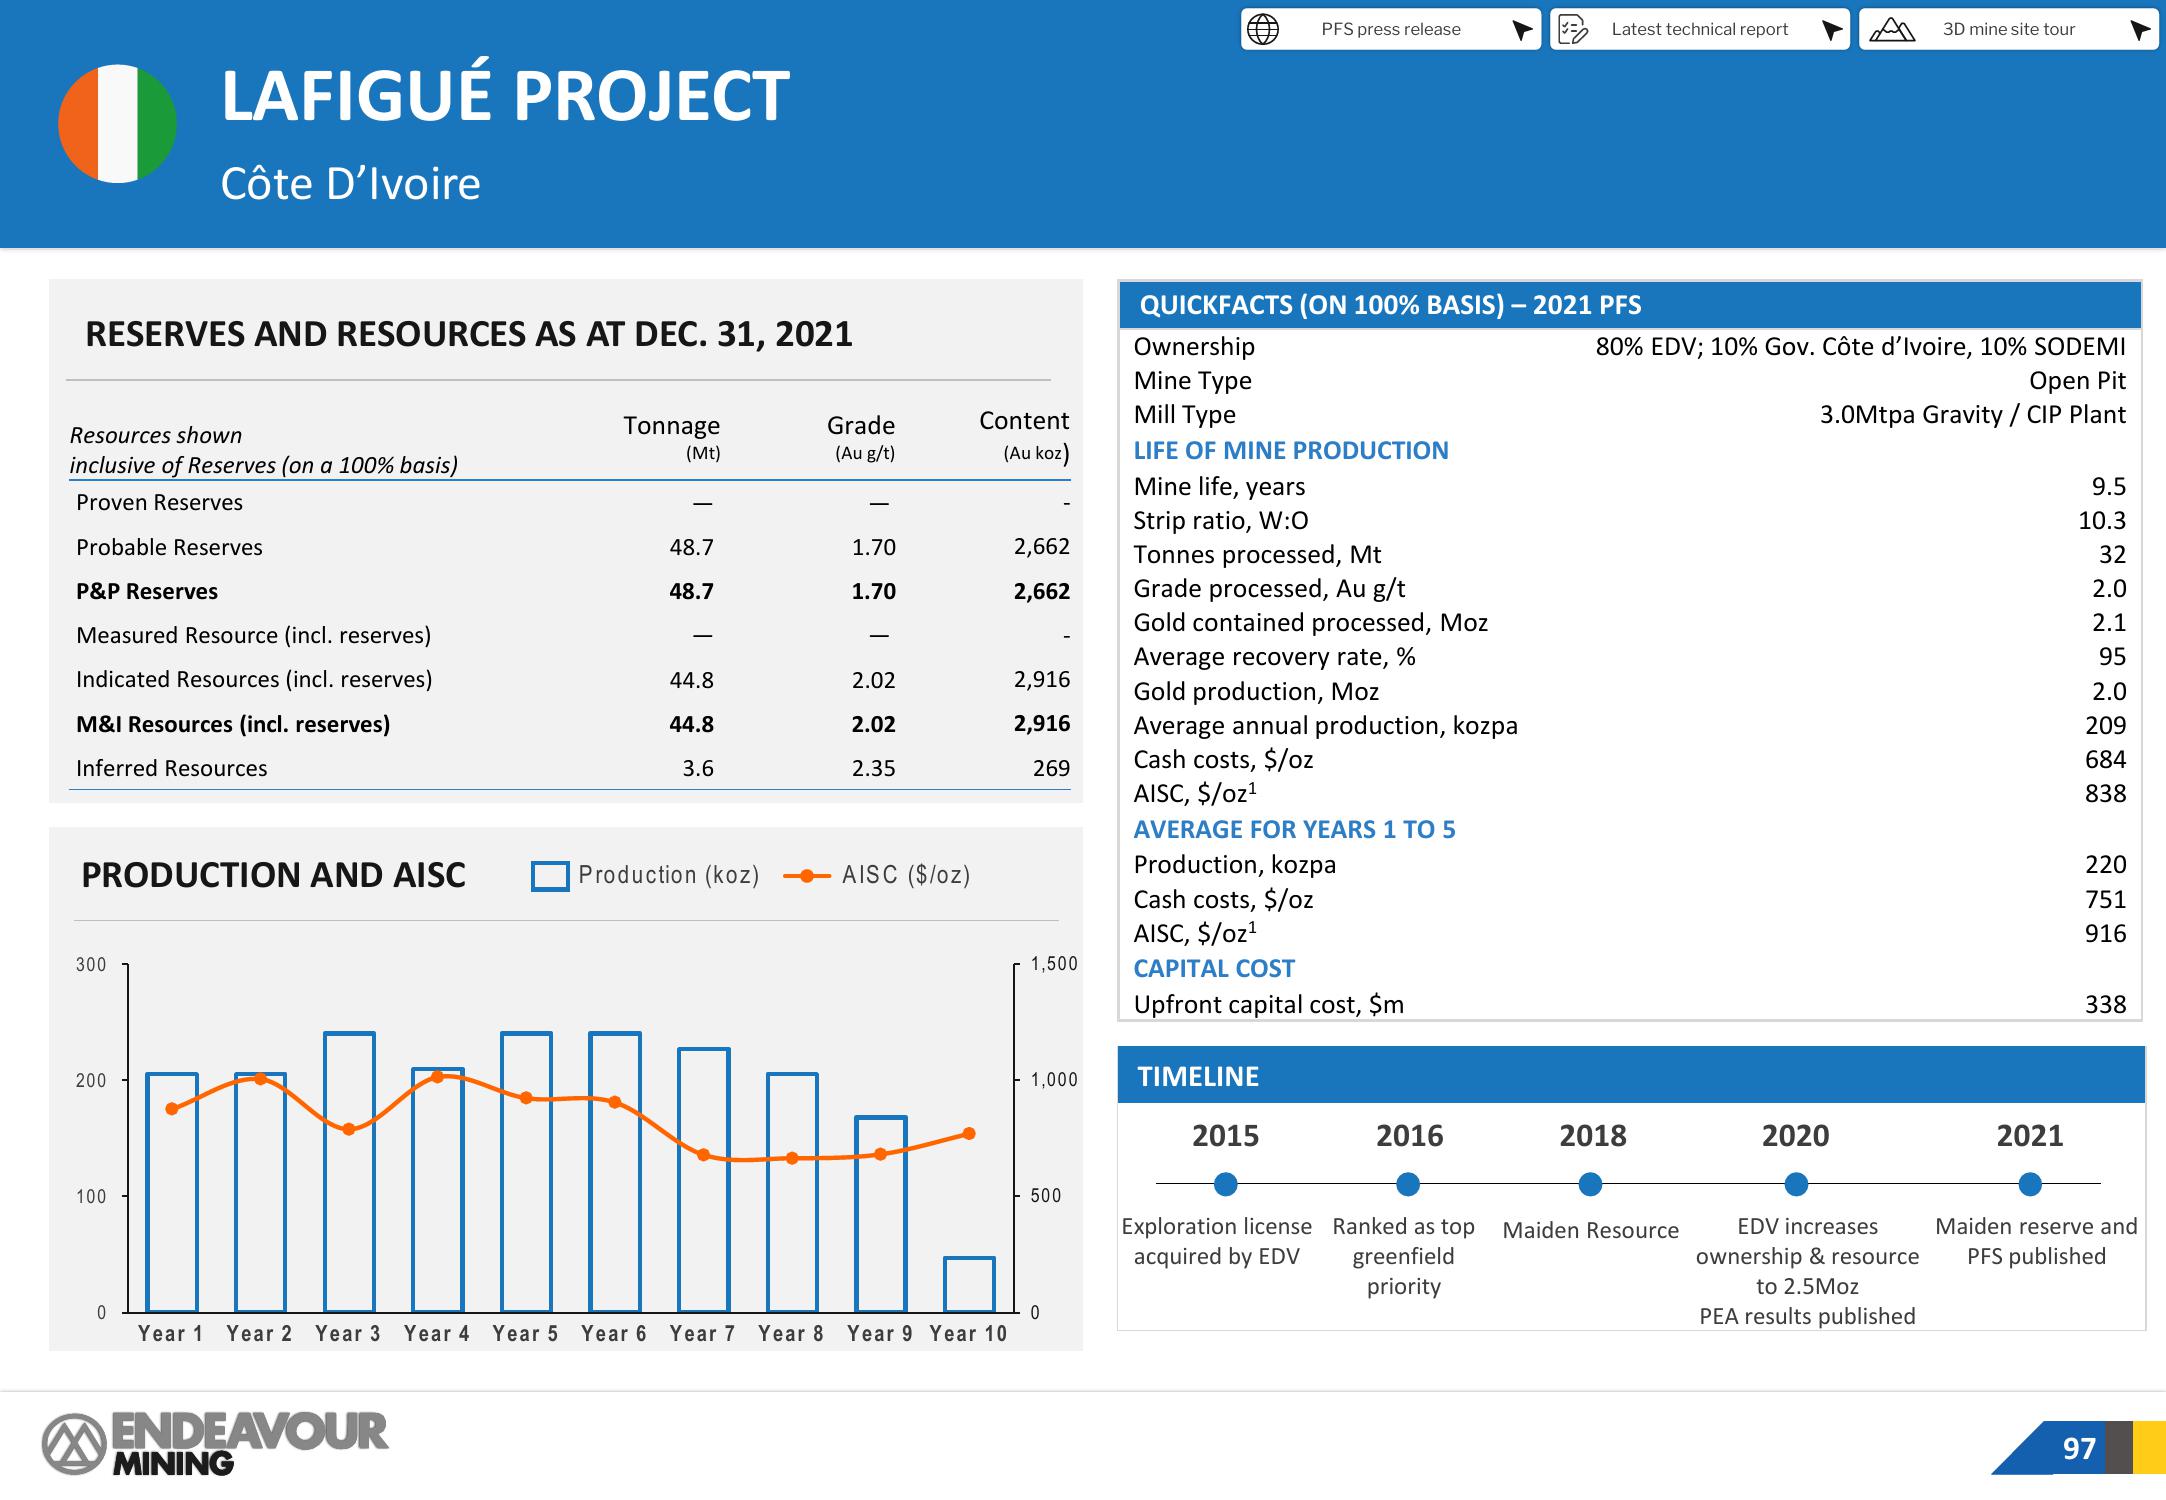
RESERVES AND RESOURCES AS AT DEC. 31, 2021
Resources shown
inclusive of Reserves (on a 100% basis)
Proven Reserves
Probable Reserves
P&P Reserves
Measured Resource (incl. reserves)
Indicated Resources (incl. reserves)
M&I Resources (incl. reserves)
Inferred Resources
PRODUCTION AND AISC
300
LAFIGUÉ PROJECT
Côte D'Ivoire
200
100
0
Year 1 Year 2 Year 3
X ENDEAVOUR
MINING
Tonnage
(Mt)
48.7
48.7
44.8
44.8
3.6
Production (koz)
MAR
Year 4 Year 5 Year 6 Year 7 Year 8
Grade
(Au g/t)
1.70
1.70
2.02
2.02
2.35
AISC ($/oz)
Content
(Au koz)
Year 9 Year 10
2,662
2,662
2,916
2,916
269
1,500
1,000
500
0
Mine life, years
Strip ratio, W:0
QUICKFACTS (ON 100% BASIS) - 2021 PFS
Ownership
Mine Type
Mill Type
LIFE OF MINE PRODUCTION
Tonnes processed, Mt
Grade processed, Au g/t
Gold contained processed, Moz
Average recovery rate, %
Gold production, Moz
PFS press release
Average annual production, kozpa
Cash costs, $/oz
AISC, $/oz¹
AVERAGE FOR YEARS 1 TO 5
Production, kozpa
Cash costs, $/oz
AISC, $/oz¹
CAPITAL COST
Upfront capital cost, $m
TIMELINE
2015
Exploration license
acquired by EDV
Latest technical report
2016
80% EDV; 10% Gov. Côte d'Ivoire, 10% SODEMI
Open Pit
3.0Mtpa Gravity / CIP Plant
2018
Ranked as top Maiden Resource
greenfield
priority
2020
3D mine site tour
EDV increases
ownership & resource
to 2.5Moz
PEA results published
2021
9.5
10.3
32
2.0
2.1
95
2.0
209
684
838
220
751
916
338
Maiden reserve and
PFS published
97View entire presentation