Uber Results Presentation Deck
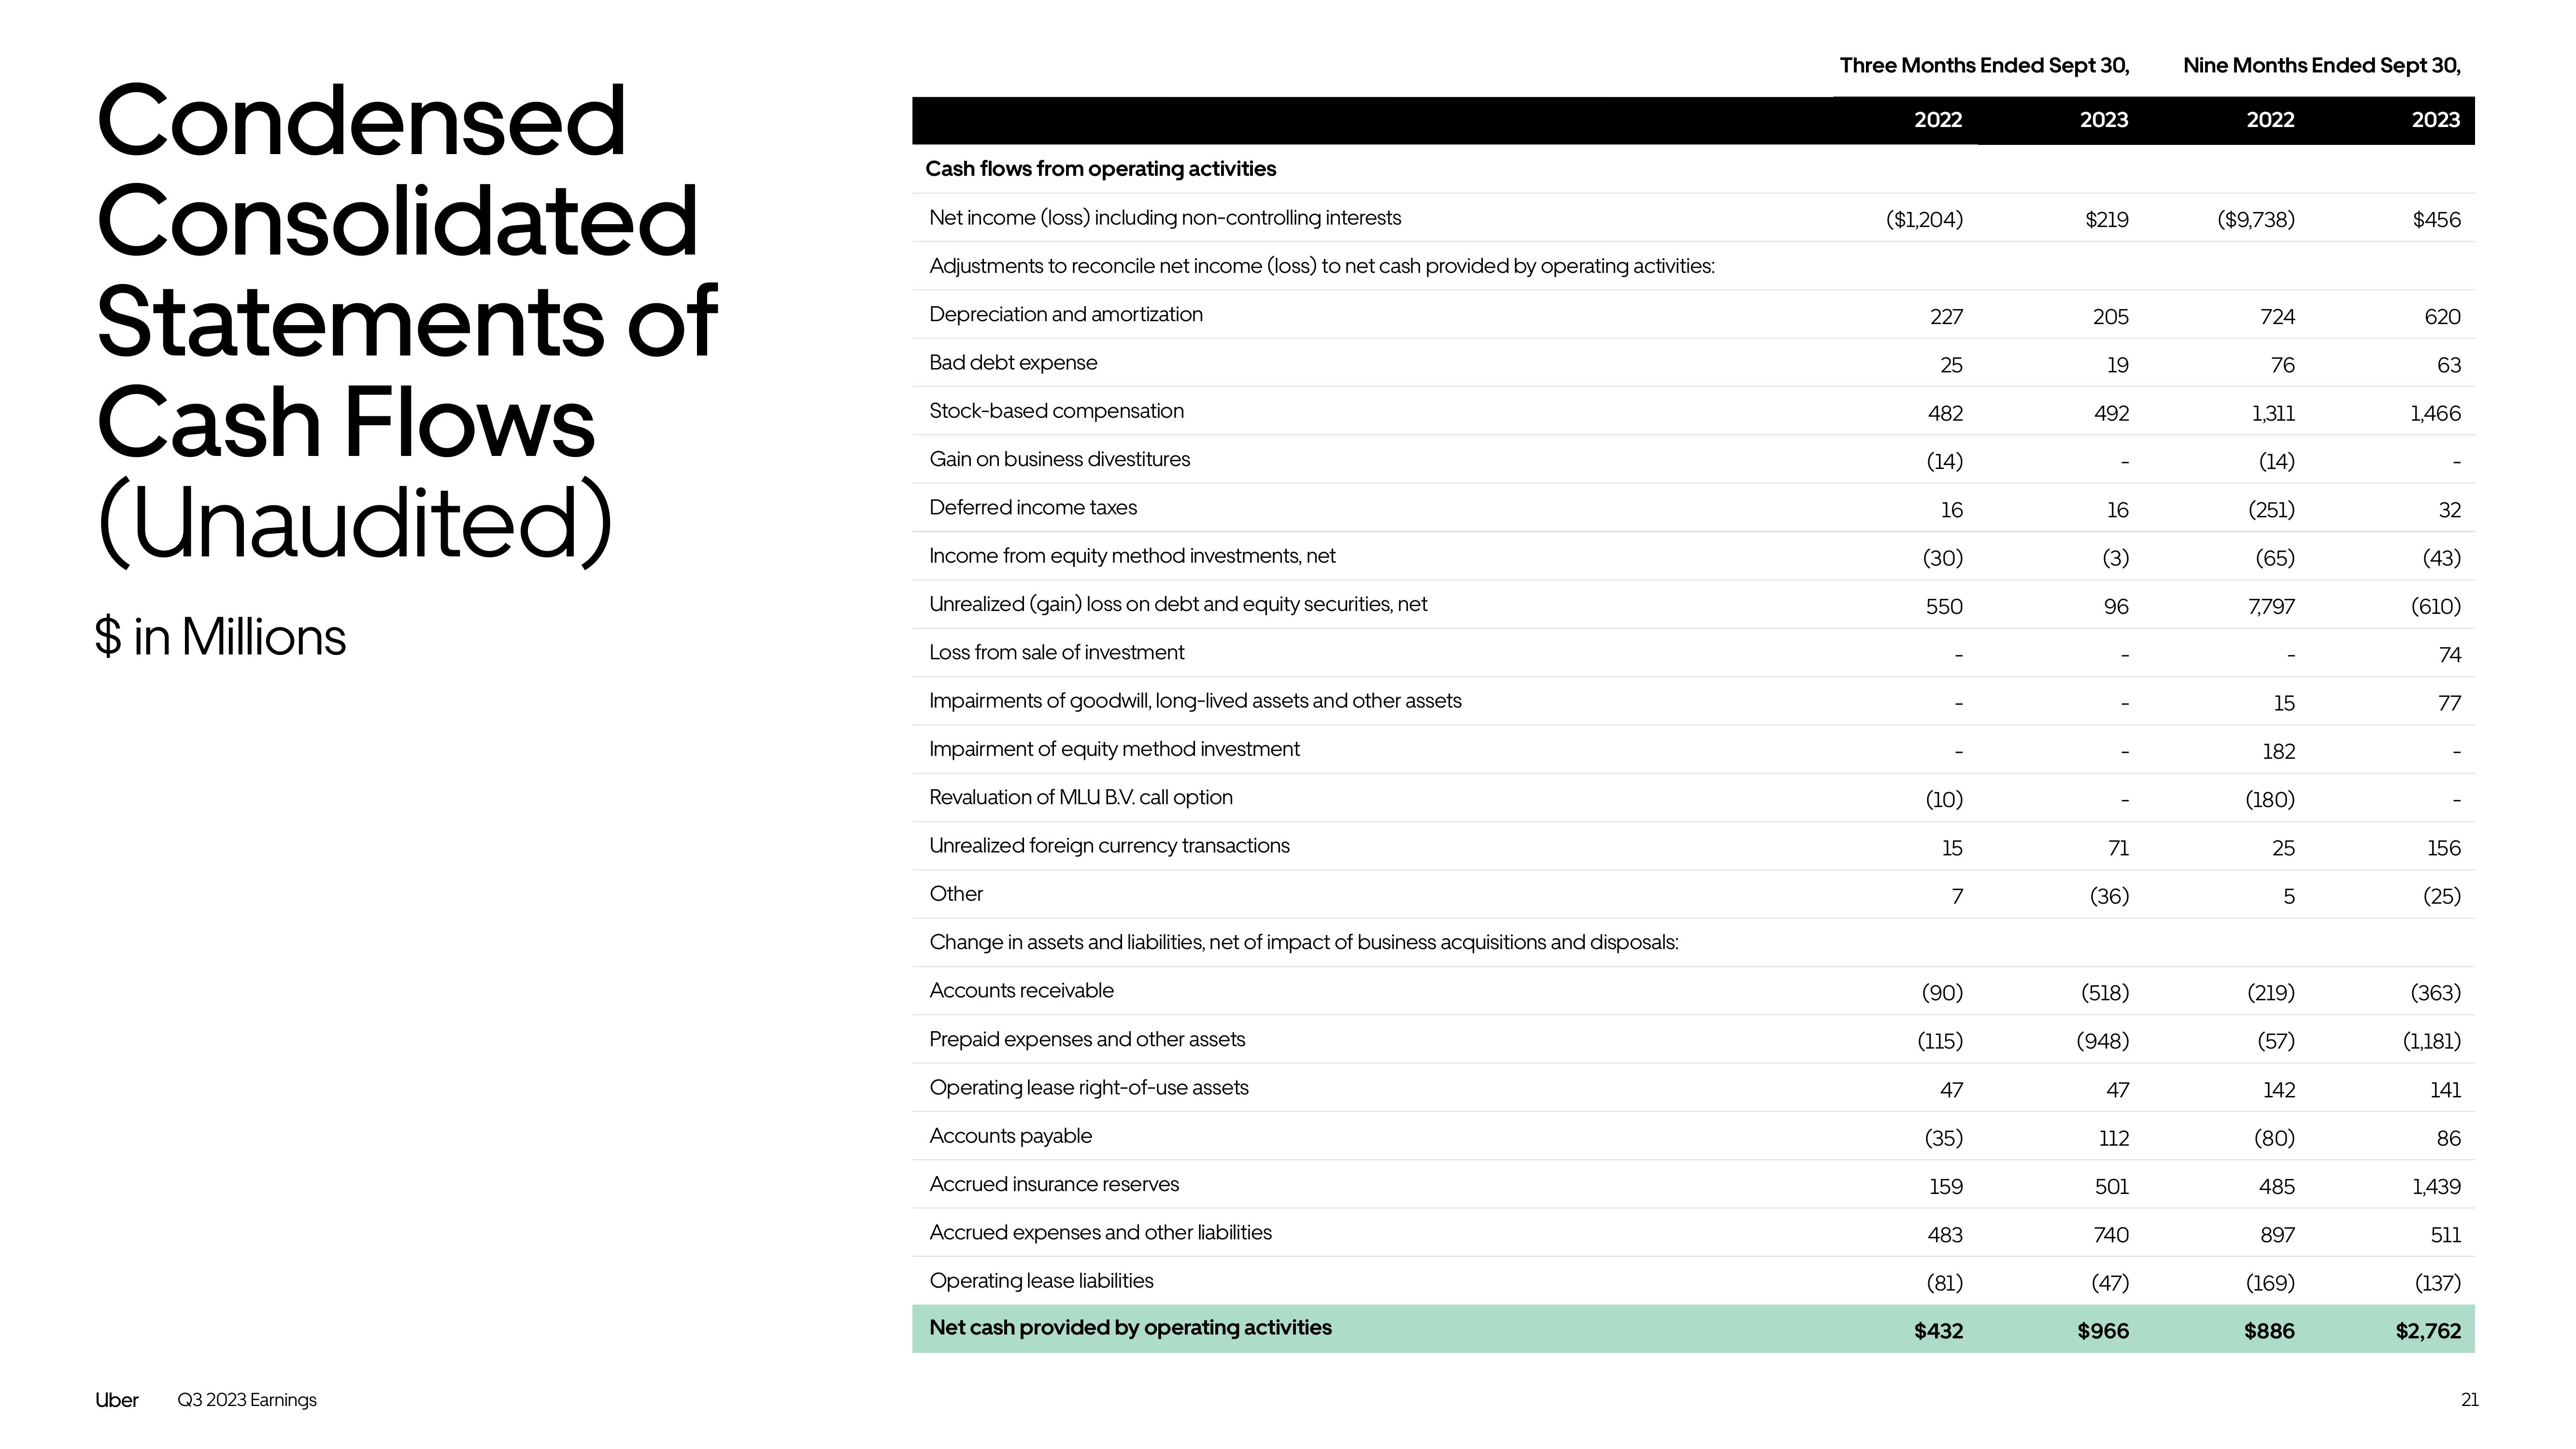
Condensed
Consolidated
Statements of
Cash Flows
(Unaudited)
$ in Millions
Uber Q3 2023 Earnings
Cash flows from operating activities
Net income (loss) including non-controlling interests
Adjustments to reconcile net income (loss) to net cash provided by operating activities:
Depreciation and amortization
Bad debt expense
Stock-based compensation
Gain on business divestitures
Deferred income taxes
Income from equity method investments, net
Unrealized (gain) loss on debt and equity securities, net
Loss from sale of investment
Impairments of goodwill, long-lived assets and other assets
Impairment of equity method investment
Revaluation of MLU B.V. call option
Unrealized foreign currency transactions
Other
Change in assets and liabilities, net of impact of business acquisitions and disposals:
Accounts receivable
Prepaid expenses and other assets
Operating lease right-of-use assets
Accounts payable
Accrued insurance reserves
Accrued expenses and other liabilities
Operating lease liabilities
Net cash provided by operating activities
Three Months Ended Sept 30,
2022
($1,204)
227
25
482
(14)
16
(30)
550
(10)
15
7
(90)
(115)
47
(35)
159
483
(81)
$432
2023
$219
205
19
492
16
(3)
96
71
(36)
(518)
(948)
47
112
501
740
(47)
$966
Nine Months Ended Sept 30,
2022
($9,738)
724
76
1,311
(14)
(251)
(65)
7,797
15
182
(180)
25
5
(219)
(57)
142
(80)
485
897
(169)
$886
2023
$456
620
63
1,466
32
(43)
(610)
74
77
156
(25)
(363)
(1,181)
141
86
1,439
511
(137)
$2,762
21View entire presentation