J.P.Morgan 4Q23 Earnings Results
JPMORGAN CHASE & CO.
SEGMENT RESULTS - MANAGED BASIS
(in millions)
TOTAL NET REVENUE (fully taxable-equivalent ("FTE"))
Consumer & Community Banking
Corporate & Investment Bank
Commercial Banking
Asset & Wealth Management
Corporate
TOTAL NET REVENUE
TOTAL NONINTEREST EXPENSE
Consumer & Community Banking
Corporate & Investment Bank
Commercial Banking
Asset & Wealth Management
Corporate
TOTAL NONINTEREST EXPENSE
PRE-PROVISION PROFIT/(LOSS)
Consumer & Community Banking
Corporate & Investment Bank
Commercial Banking
Asset & Wealth Management
Corporate
PRE-PROVISION PROFIT
PROVISION FOR CREDIT LOSSES
Consumer & Community Banking
Corporate & Investment Bank
Commercial Banking
Asset & Wealth Management
Corporate
PROVISION FOR CREDIT LOSSES
NET INCOME/(LOSS)
Consumer & Community Banking
Corporate & Investment Bank
Commercial Banking
Asset & Wealth Management
Corporate
TOTAL NET INCOME
$
$
$
$
$
$
$
$
4Q23
1,707
(1,816)
$ 15,457
$
18,097
10,958
4,016
5,095
1,777
39,943
9,336
6,774
1,395
3,388
3,593
24,486
8,761
4,184
2,621
2,189
210
366
(1)
(2)
2,762
4,788
2,524
1,653
1,217
(875)
9,307
$
$
$
9,105
7,443
1,375
3,138
696
$ 21,757
$
3Q23
9,257
4,287
2,656
1,867
862
$ 18,929
$
18,362
11,730
4,031
5,005
1,558
40,686
$
1,446
(185)
90
(13)
46
1,384
5,895
3,092
1,935
1,417
812
$ 13,151
$
17,233
12,519
3,988
4,943
3,718
$ 42,401
$
$
$
$
2Q23
$
QUARTERLY TRENDS
8,313
6,894
1,300
3,163
1,152
20,822
8,920
5,625
2,688
1,780
2,566
21,579
1,862
38
1,097
145
(243)
2,899
5,306
4,092
1,208
1,226
2,640
$ 14,472
$
$
$
$
8,065
7,483
1,308
3,091
160
$ 20,107
$
$
1Q23
$
16,456
13,600
3,511
4,784
985
39,336
8,391
6,117
2,203
1,693
825
19,229
1,402
58
417
28
370
2,275
5,243
4,421
1,347
1,367
244
$ 12,622
$
$
$
$
$
$
$
$
$
$
4Q22
15,793 (a)
10,598 (a)
3,404
4,588
1,183
35,566
7,912 (a)
6,495 (a)
1,254
3,022
339
19,022
7,881
4,103
2,150
1,566
844
16,544
1,845
141
284
32
(14)
2,288
4,556
3,314
1,423
1,134
581
11,008
4Q23 Change
3Q23
(1)%
(7)
2
14
(2)
3
(9)
1
8
416
13
(5)
(2)
(1)
(9)
NM
(18)
51
NM
307
92
NM
100
(19)
(18)
(15)
(14)
NM
(29)
JPMORGAN CHASE & CO.
4Q22
15 %
3
18
11
50
12
18
4
11
12
NM
29
ONNI
NM
(7)
19
49
29
NM
86
21
5
(24)
16
7
NM
(15)
$
$
$
$
$
$
$
$
$
$
2023
70,148
48,807
15,546
19,827
8,038
162,366
34,819
28,594
5,378
12,780
5,601
87,172
35,329
20,213
10,168
7,047
2,437
75,194
6,899
121
1,970
159
171
9,320
21,232
14,129
6,143
5,227
2,821
49,552
FULL YEAR
$
54,814 (a)
48,102 (a)
11,533
17,748
80
$ 132,277
$
$
$
$
$
2022
$
31,208 (a)
27,350 (a)
4,719
11,829
1,034
76,140
23,606
20,752
6,814
5,919
(954)
56,137
3,813
1,158
1,268
128
22
6,389
14,916
14,925
4,213
4,365
(743)
37,676
2023 Change
2022
28 %
1
35
12
NM
23
ܗ ܟ ܣ
442
50
(3)
49
19
NM
34
81
(90)
55
24
NM
46
42
(5)
46
20
NM
32
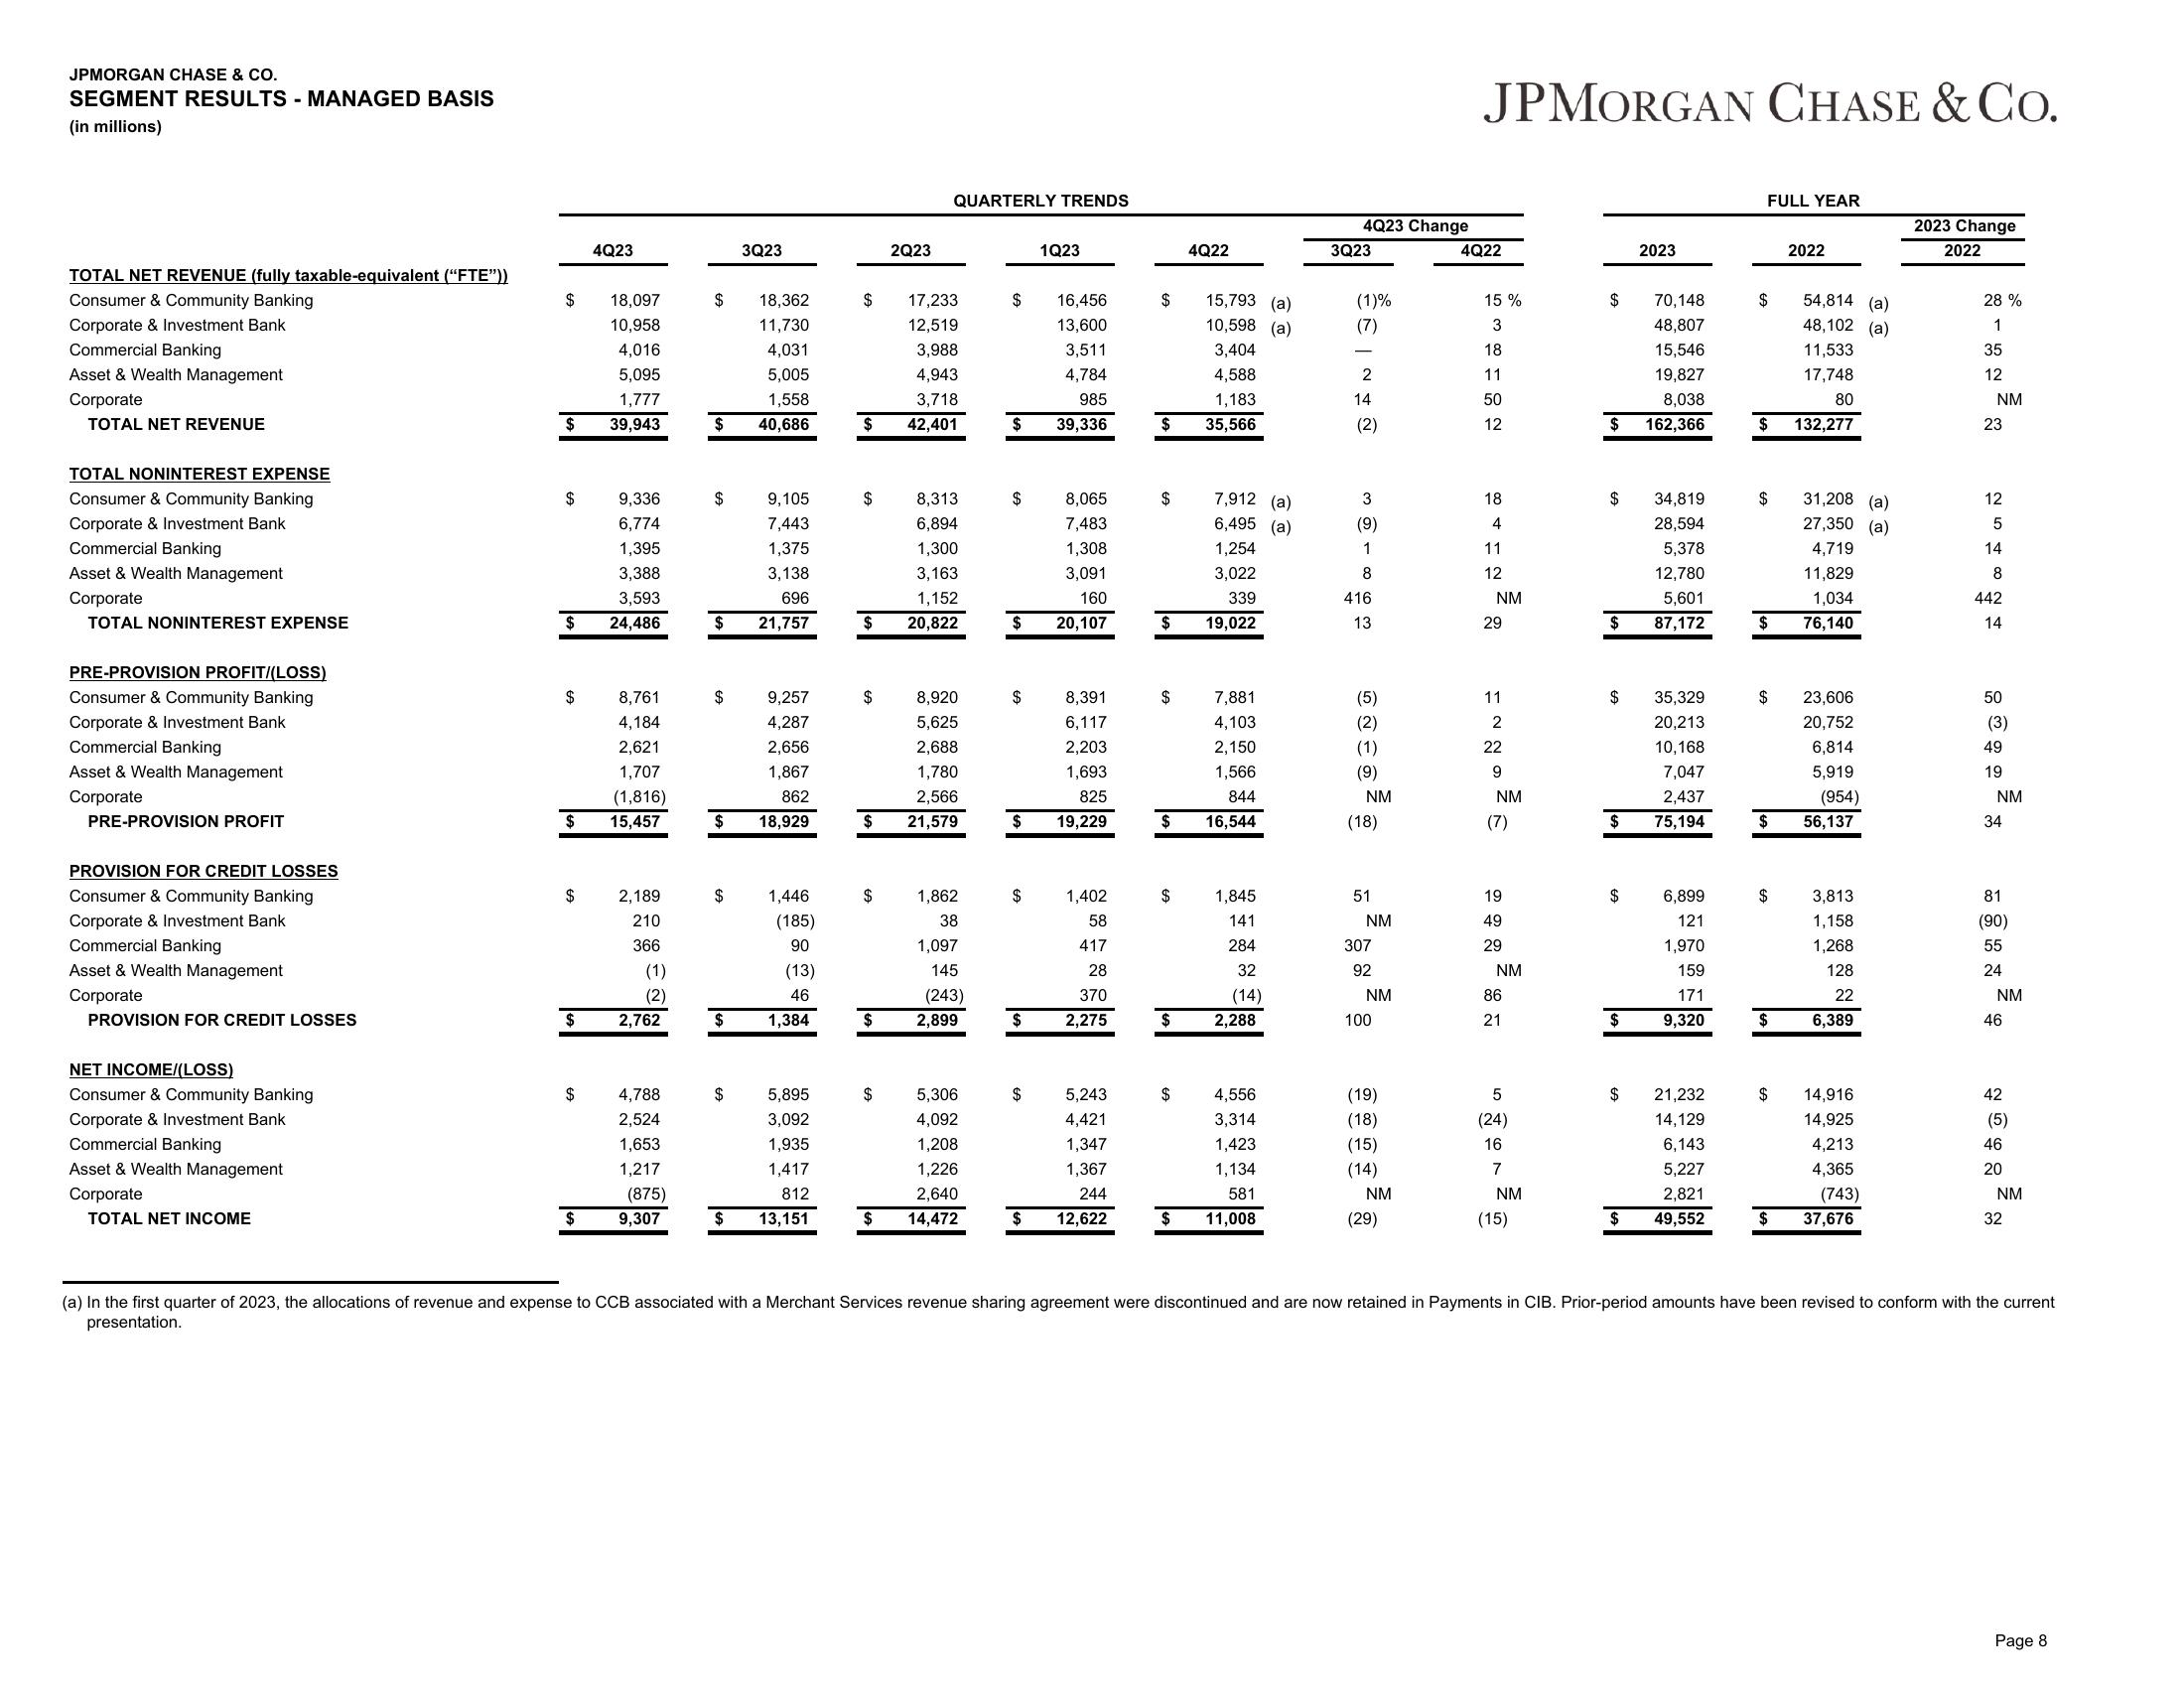
(a) In the first quarter of 2023, the allocations of revenue and expense to CCB associated with a Merchant Services revenue sharing agreement were discontinued and are now retained in Payments in CIB. Prior-period amounts have been revised to conform with the current
presentation.
Page 8View entire presentation