Tudor, Pickering, Holt & Co Investment Banking
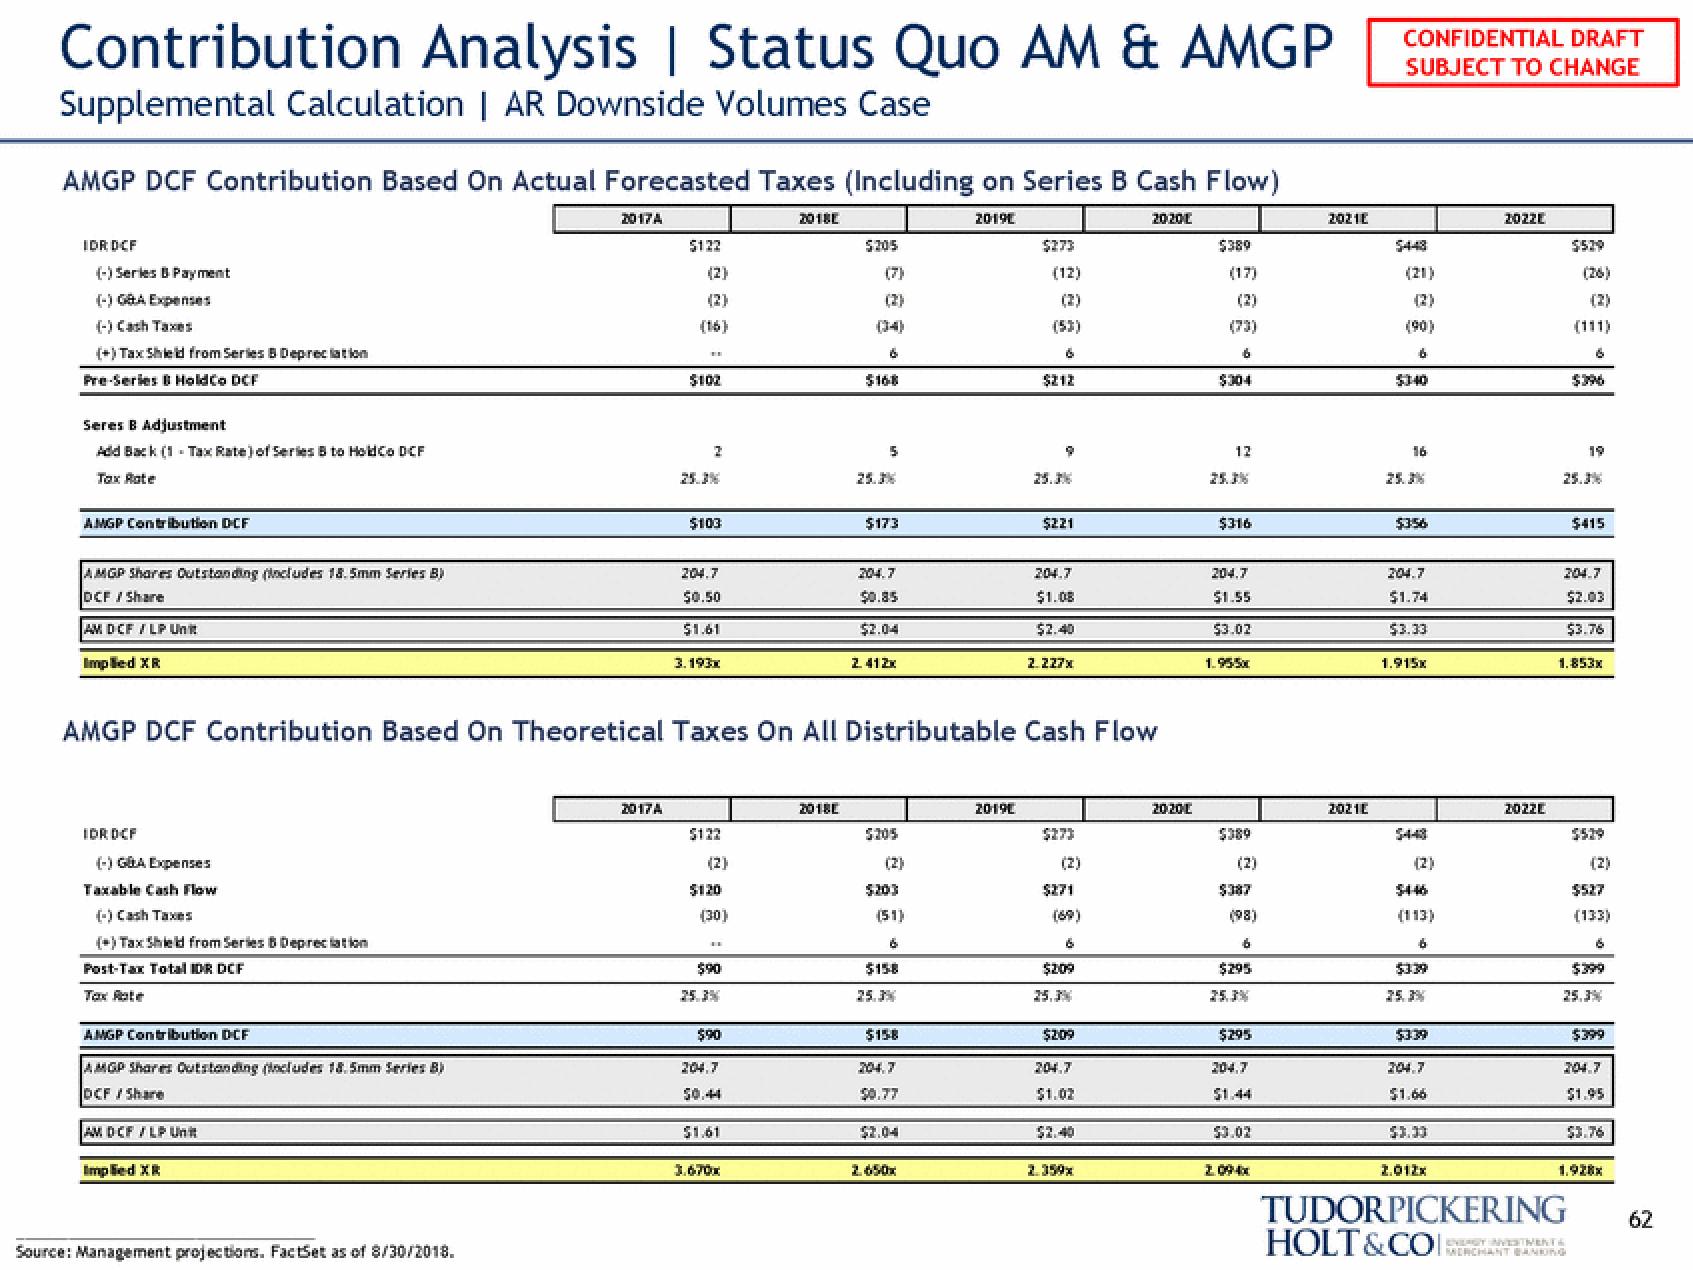
Contribution Analysis | Status Quo AM & AMGP
Supplemental Calculation | AR Downside Volumes Case
AMGP DCF Contribution Based On Actual Forecasted Taxes (Including on Series B Cash Flow)
2019E
2020E
IDR DCF
(-) Series B Payment
(-) GBA Expenses
(-) Cash Taxes
(+) Tax Shield from Series B Depreciation
Pre-Series B HoldCo DCF
Seres B Adjustment
Add Back (1 Tax Rate) of Series B to HoldCo DCF
Tax Rate
AMGP Contribution DCF
AMGP Shares Outstanding (includes 18.5mm Series B)
DCF / Share
AM DCF / LP Unit
Impled XR
IDR DCF
(-) GUA Expenses
Taxable Cash Flow
(-) Cash Taxes
(+)Tax Shield from Series & Depreciation
Post-Tax Total IDR DCF
Tax Rate
AMGP Contribution DCF
AMGP Shares Outstanding includes 18.5mm Series Bi
DCF/Share
AM DCF / LP Unit
Implied XR
2017A
Source: Management projections. FactSet as of 8/30/2018.
$122
2017A
(16)
$102
$103
204.7
$0.50
$1.61
3.193x
$122
(2)
$120
(30)
$90
$90
AMGP DCF Contribution Based On Theoretical Taxes On All Distributable Cash Flow
204,7
$1.61
2018E
3.670x
$205
2018E
(7)
(2)
&
$168
5
25.3%
$173
204.7
$0.85
$2.04
2. 412x
$305
(2)
(51)
6
$158
25.3%
$158
204,7
$0.77
$2.04
2.650x
(12)
20190
$212
9
25.36
$221
204.7
$1.08
$2.40
2.227x
(2)
$271
6
$209
$209
204,7
$1.02
$2.40
2.359x
2020L
$389
(17)
(73)
6
$304
12
$316
204.7
$1.55
$3.02
1.955x
$389
$387
(98)
6
$295
$295
204.7
$3.02
2021E
2021E
CONFIDENTIAL DRAFT
SUBJECT TO CHANGE
$443
(21)
(2)
(90)
6
5340
16
$356
204.7
$1.74
$3.33
1.915x
(113)
6
$339
25.3%
$339
204.7
$1.66
$3.30
2022E
2022E
$529
(26)
(2)
$396
204.7
$2.03
$3.76
$415
1.853x
2.012x
TUDORPICKERING
HOLT&CO
CHEAST INVESTMENTS
MERCHANT BANKING
$527
(133)
25.3%
6
204.7
$1.95
$399
62View entire presentation