Procore IPO Presentation Deck
TOP-DOWN
Massive Market Opportunity: Two Approaches
Total number of
Organizations4
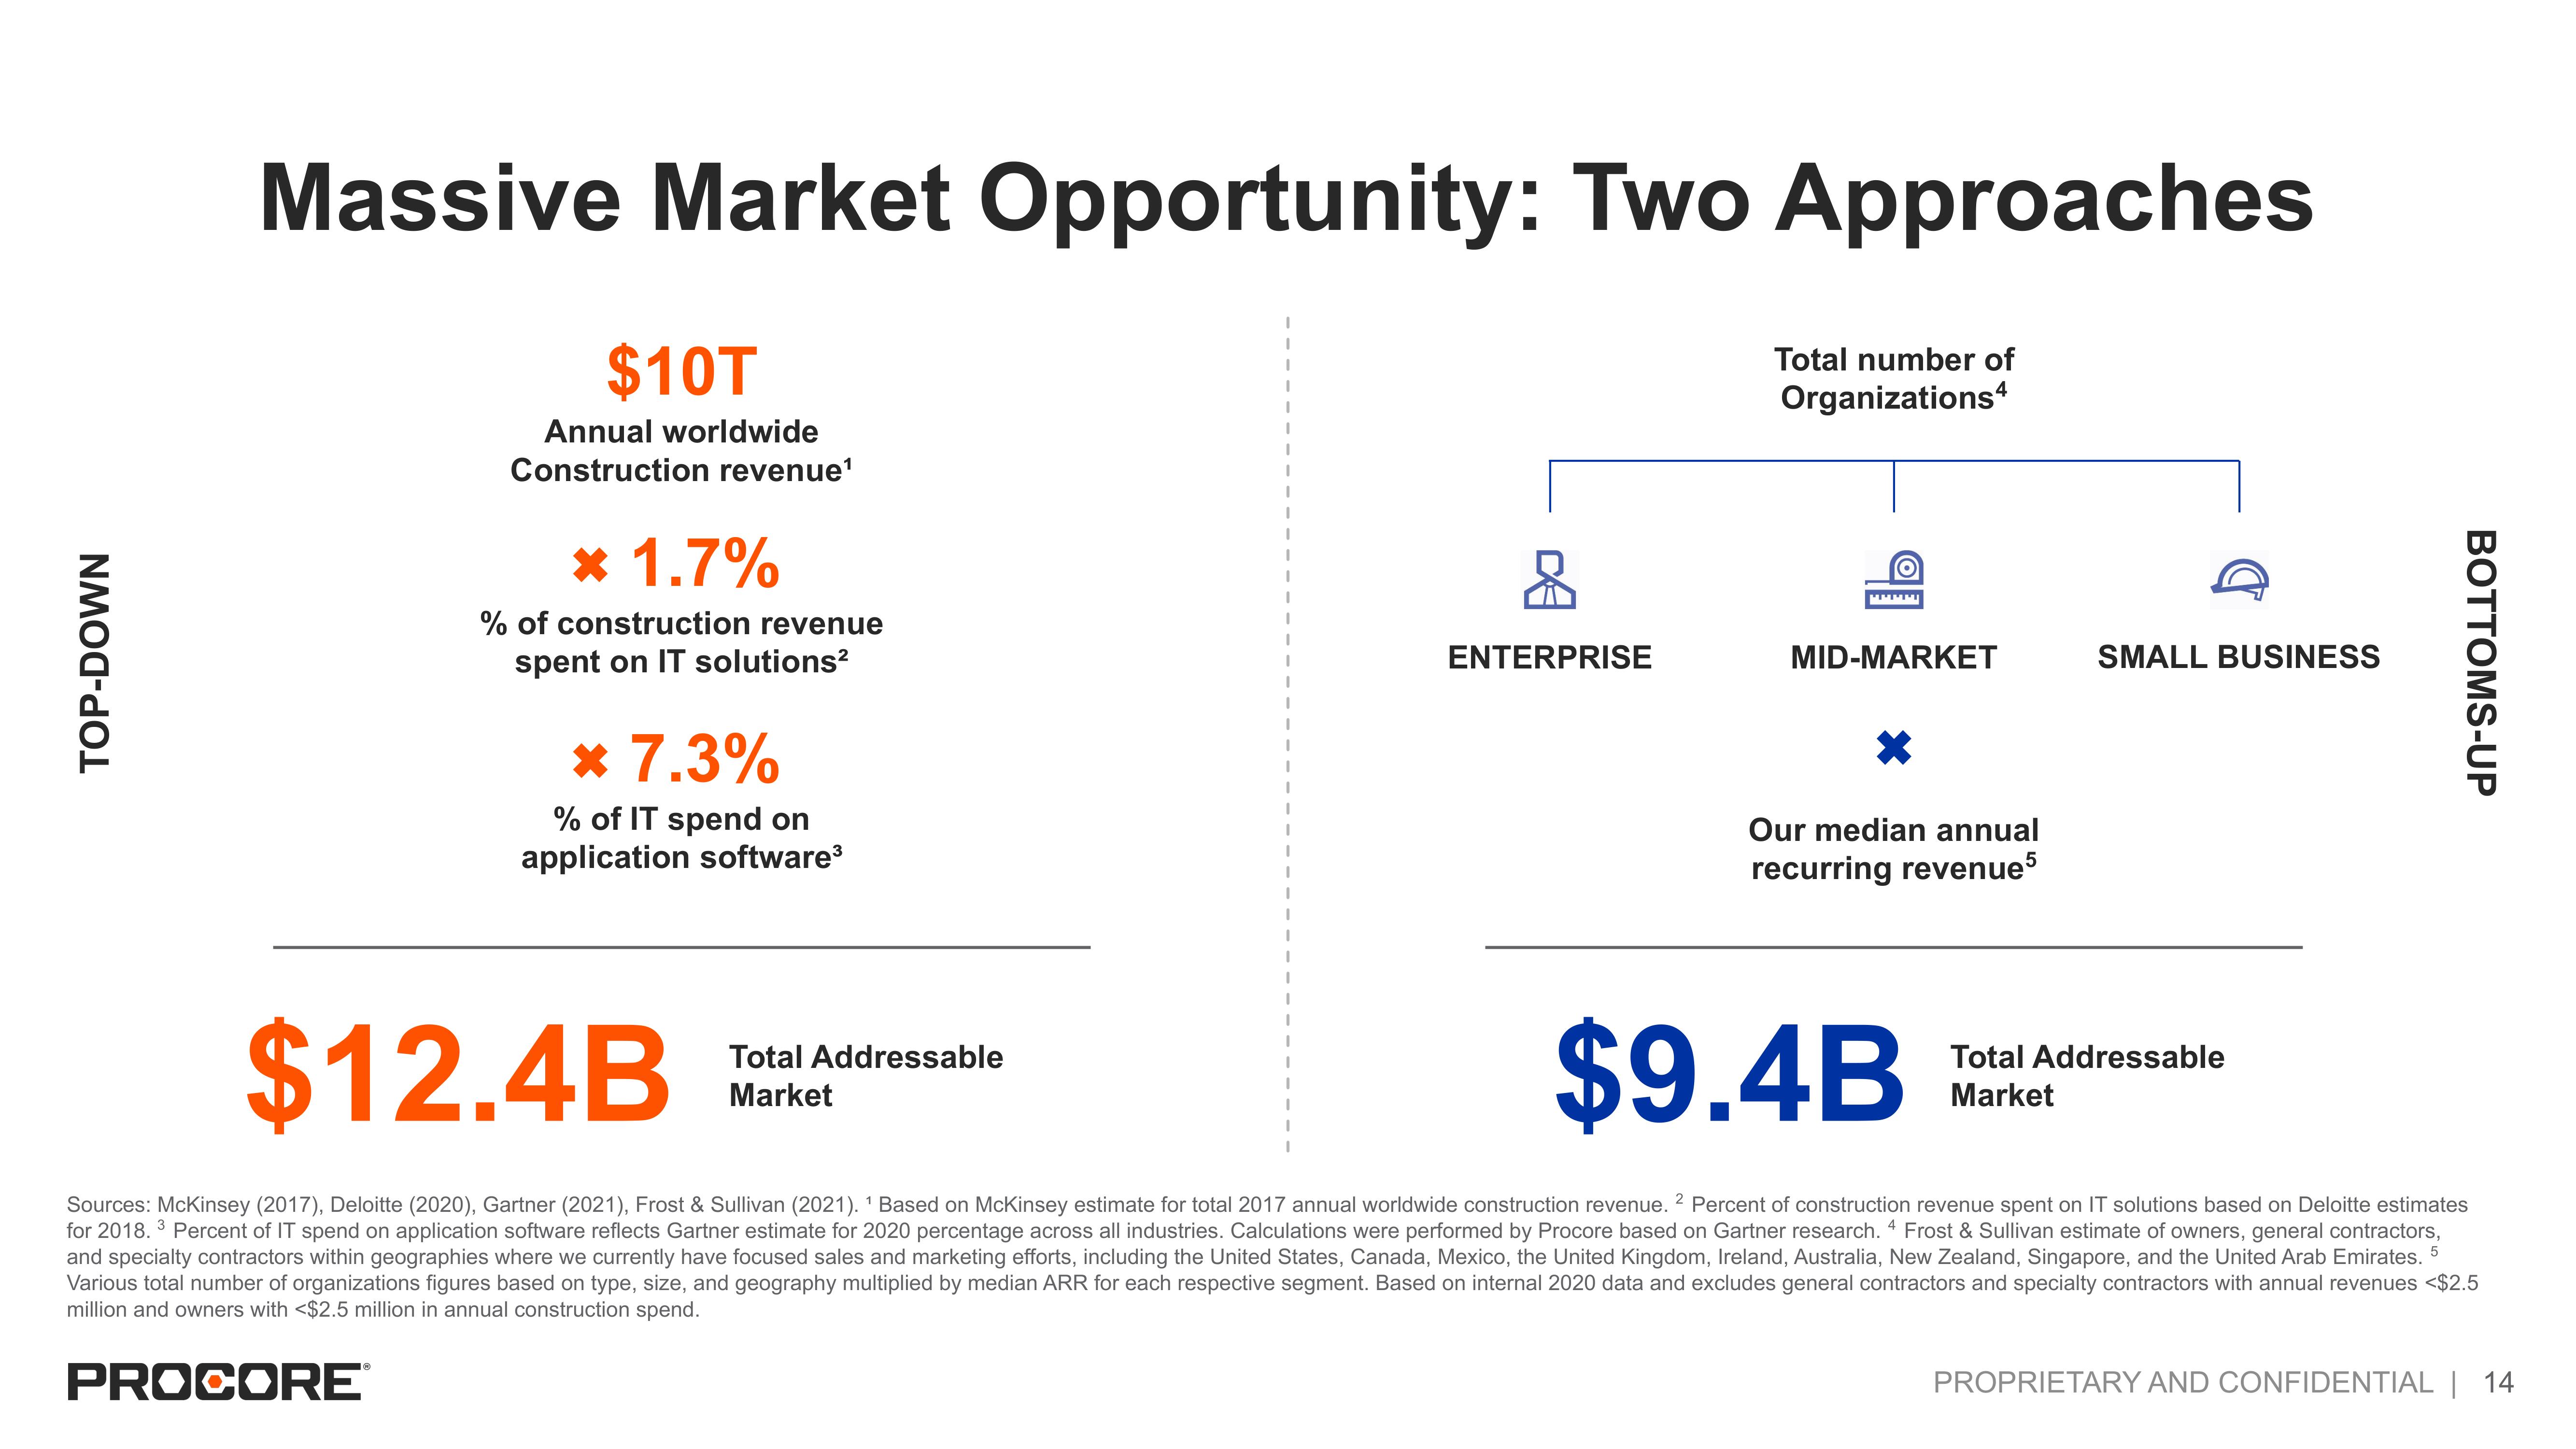
$10T
Annual worldwide
Construction revenue¹
* 1.7%
% of construction revenue
spent on IT solutions²
* 7.3%
% of IT spend on
application software³
ENTERPRISE
Total Addressable
Market
O
MID-MARKET
Our median annual
recurring revenue5
SMALL BUSINESS
$12.4B
$9.4B
Sources: McKinsey (2017), Deloitte (2020), Gartner (2021), Frost & Sullivan (2021). ¹ Based on McKinsey estimate for total 2017 annual worldwide construction revenue. 2 Percent of construction revenue spent on IT solutions based on Deloitte estimates
for 2018. ³ Percent of IT spend on application software reflects Gartner estimate for 2020 percentage across all industries. Calculations were performed by Procore based on Gartner research. 4 Frost & Sullivan estimate of owners, general contractors,
and specialty contractors within geographies where we currently have focused sales and marketing efforts, including the United States, Canada, Mexico, the United Kingdom, Ireland, Australia, New Zealand, Singapore, and the United Arab Emirates. 5
Various total number of organizations figures based on type, size, and geography multiplied by median ARR for each respective segment. Based on internal 2020 data and excludes general contractors and specialty contractors with annual revenues <$2.5
million and owners with <$2.5 million in annual construction spend.
PROCORE®
BOTTOMS-UP
Total Addressable
Market
PROPRIETARY AND CONFIDENTIAL | 14View entire presentation