Fourth Quarter & FY2023 Financial Update
Adj. CASM + Net Interest (SLA 1,000)²
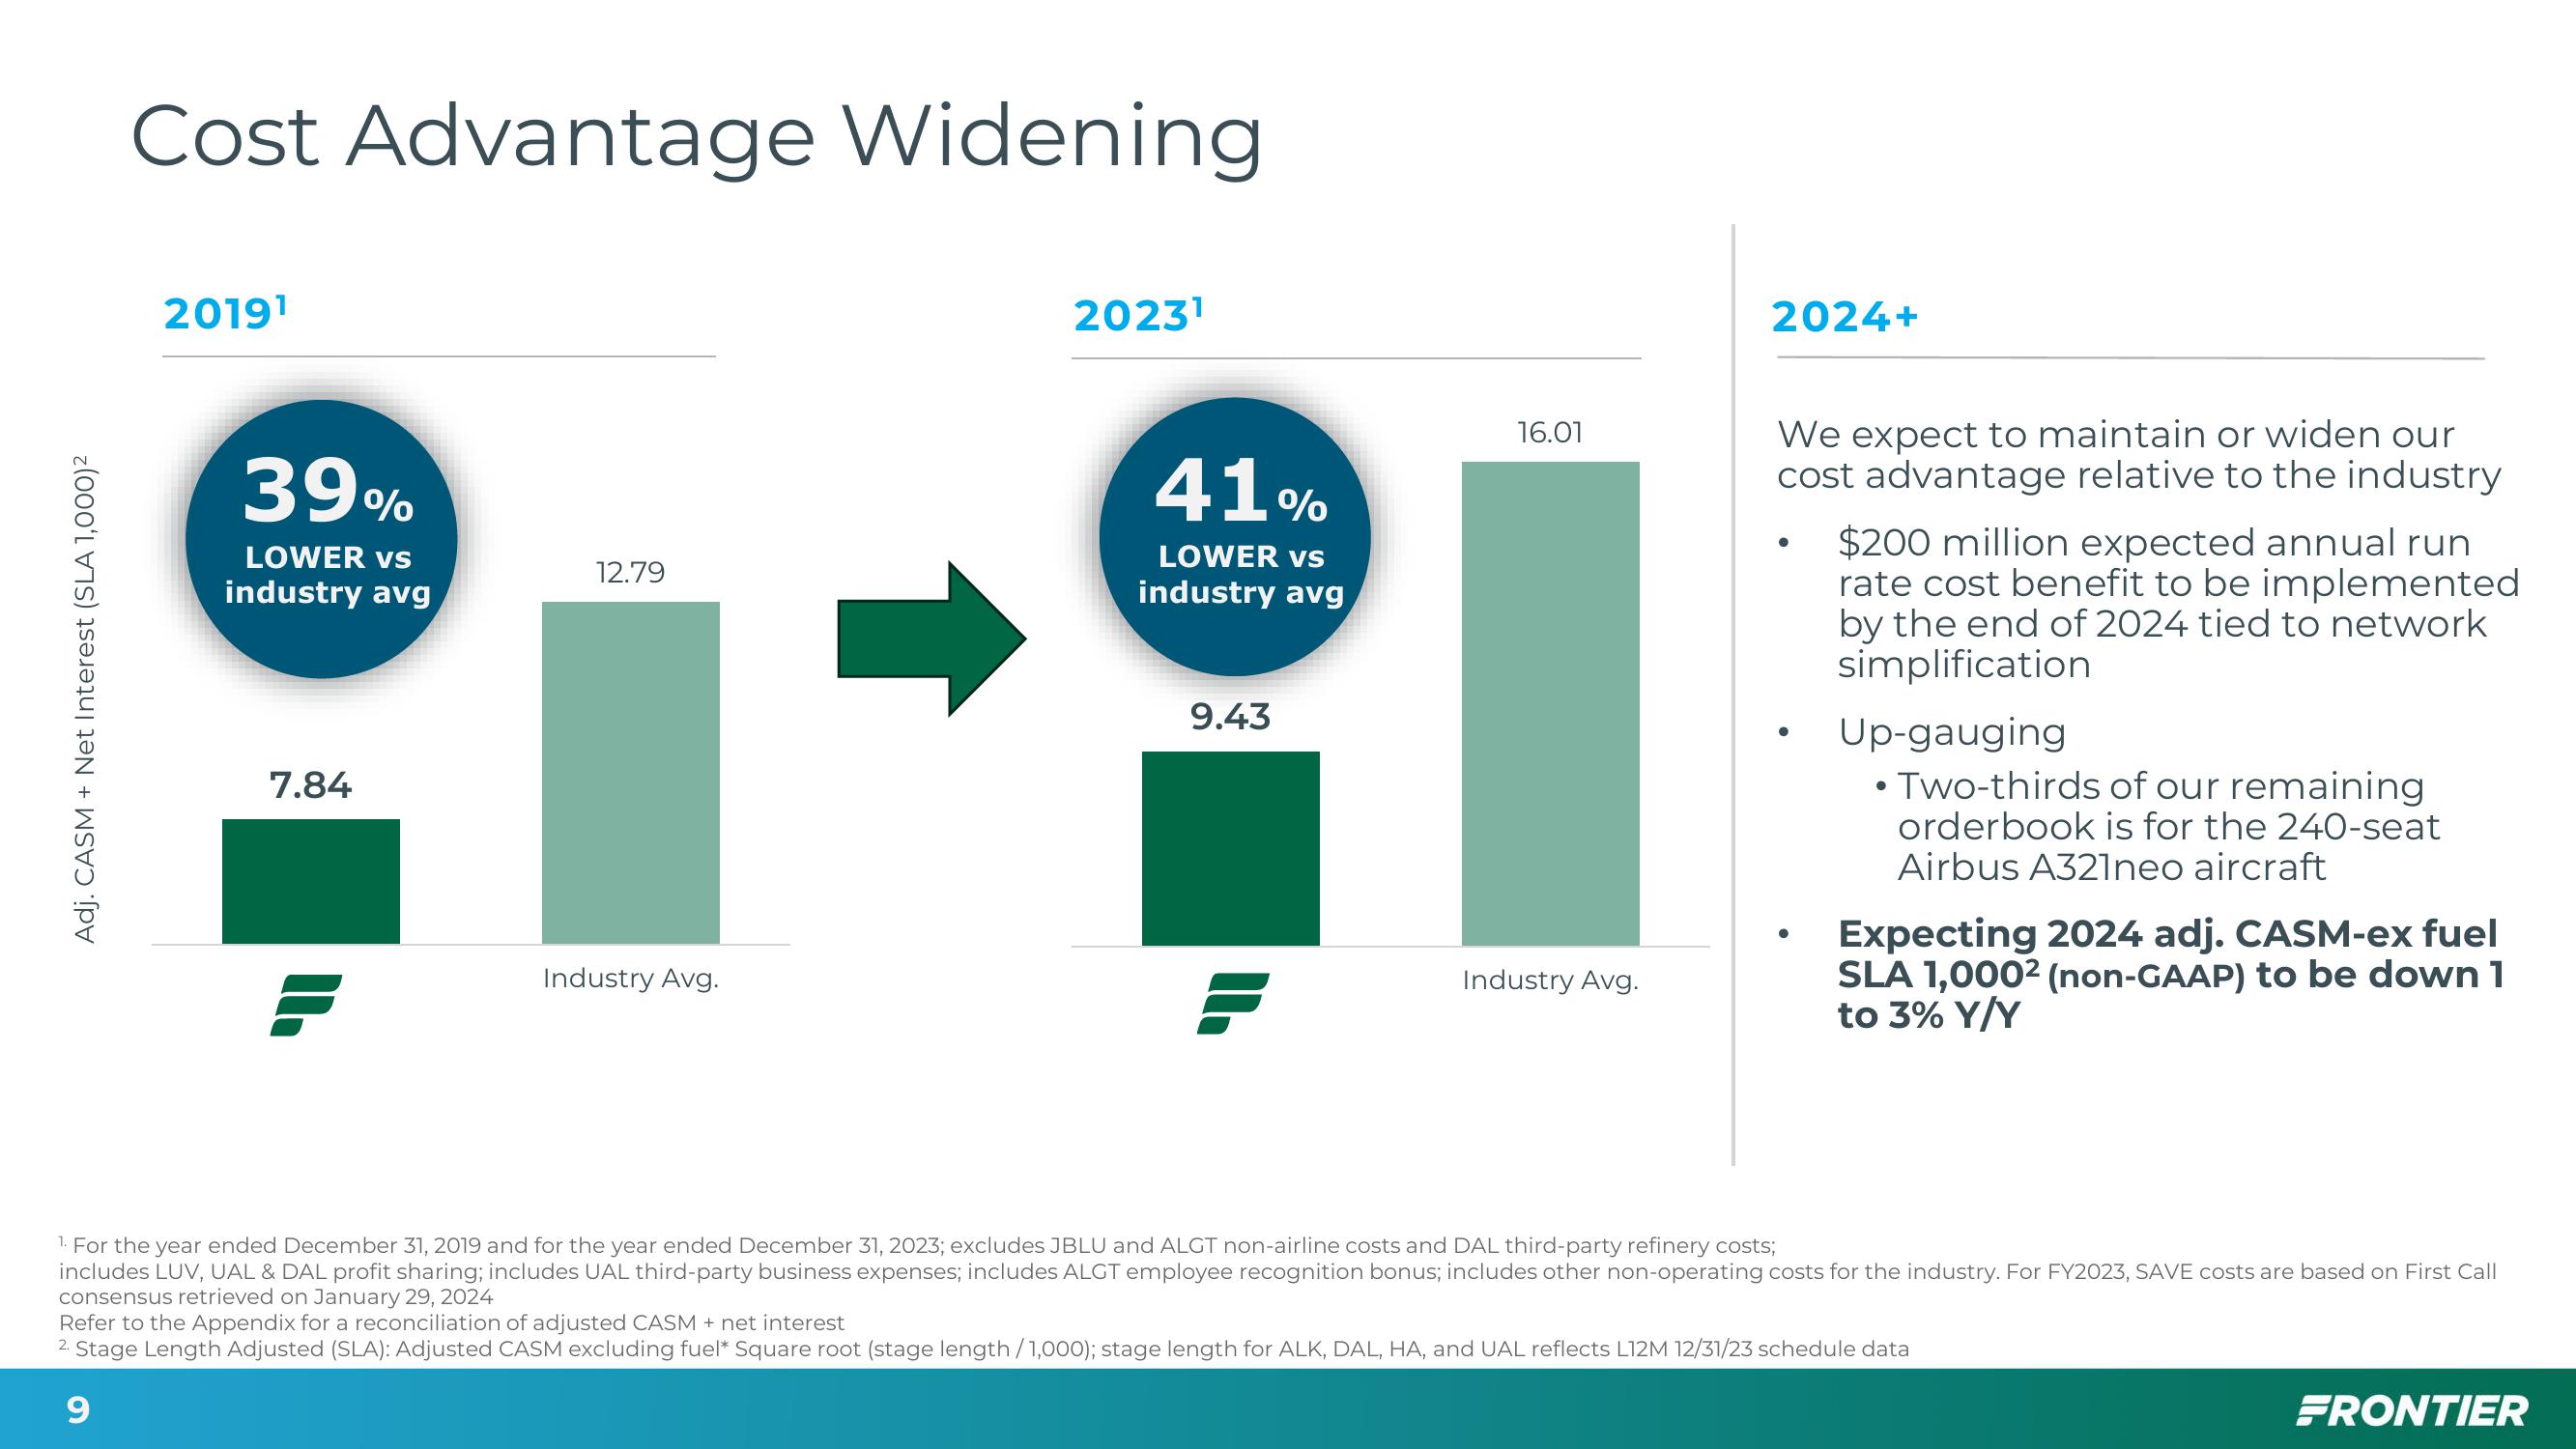
Cost Advantage Widening
2019¹
39%
LOWER vs
industry avg
7.84
12.79
Industry Avg.
2023¹
41%
LOWER vs
industry avg
9.43
P
16.01
Industry Avg.
2024+
We expect to maintain or widen our
cost advantage relative to the industry
●
●
$200 million expected annual run
rate cost benefit to be implemented
by the end of 2024 tied to network
simplification
Up-gauging
• Two-thirds of our remaining
orderbook is for the 240-seat
Airbus A321neo aircraft
Expecting 2024 adj. CASM-ex fuel
SLA 1,000² (non-GAAP) to be down 1
to 3% Y/Y
1. For the year ended December 31, 2019 and for the year ended December 31, 2023; excludes JBLU and ALGT non-airline costs and DAL third-party refinery costs;
includes LUV, UAL & DAL profit sharing; includes UAL third-party business expenses; includes ALGT employee recognition bonus; includes other non-operating costs for the industry. For FY2023, SAVE costs are based on First Call
consensus retrieved on January 29, 2024
Refer to the Appendix for a reconciliation of adjusted CASM + net interest
2. Stage Length Adjusted (SLA): Adjusted CASM excluding fuel* Square root (stage length/1,000); stage length for ALK, DAL, HA, and UAL reflects L12M 12/31/23 schedule data
9
FRONTIERView entire presentation