Tudor, Pickering, Holt & Co Investment Banking
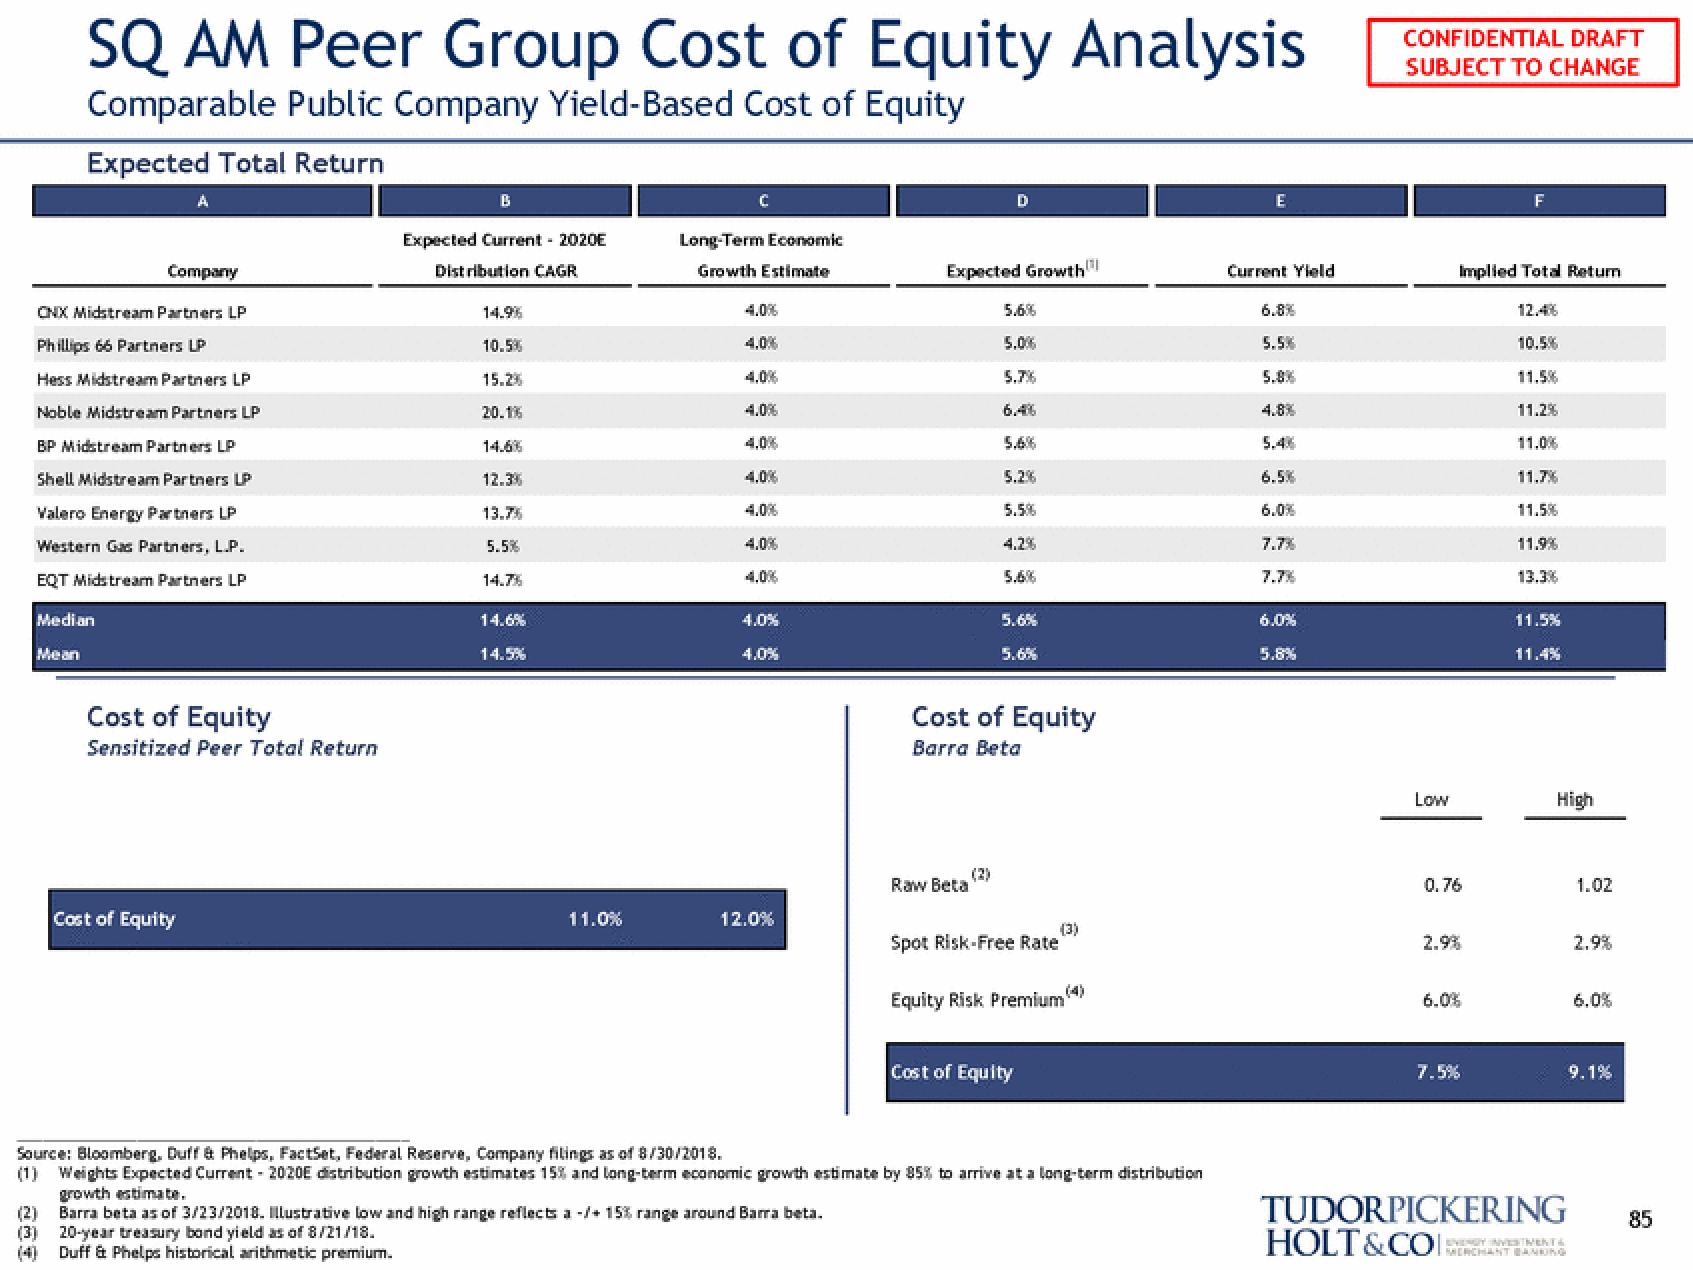
SQ AM Peer Group Cost of Equity Analysis
Comparable Public Company Yield-Based Cost of Equity
Expected Total Return
Company
CNX Midstream Partners LP
Phillips 66 Partners LP
Hess Midstream Partners LP
Noble Midstream Partners LP
BP Midstream Partners LP
Shell Midstream Partners LP
Valero Energy Partners LP
Western Gas Partners, L.P.
EQT Midstream Partners LP
Median
Mean
Cost of Equity
Sensitized Peer Total Return
Cost of Equity
B
Expected Current - 2020E
Distribution CAGR
14.96
10.5%
15.2%
20.1%
12.3%
13.7%
5.5%
14.7%
14.6%
14.5%
11.0%
Long-Term Economic
Growth Estimate
4.0%
4.0%
4.0%
4.0%
4.0%
4.0%
12.0%
Expected Growth
Raw Beta
D
(2)
5.6%
5.0%
5.7%
5.2%
5.5%
5.6%
Cost of Equity
Barra Beta
5.6%
5.6%
(3)
Spot Risk-Free Rate
Cost of Equity
Equity Risk Premium
Source: Bloomberg, Duff & Phelps, FactSet, Federal Reserve, Company filings as of 8/30/2018.
(1) Weights Expected Current - 2020E distribution growth estimates 15% and long-term economic growth estimate by 85% to arrive at a long-term distribution
growth estimate.
(2)
Barra beta as of 3/23/2018. Illustrative low and high range reflects a -/+ 15% range around Barra beta.
(3) 20-year treasury bond yield as of 8/21/18.
Duff & Phelps historical arithmetic premium.
E
Current Yield
5.5%
5.8%
4.8%
5.4%
6.5%
6.0%
7.7%
7.7%
6.0%
5.8%
CONFIDENTIAL DRAFT
SUBJECT TO CHANGE
Low
Implied Total Return
0.76
6.0%
7.5%
12.4%
10.5%
11.5%
11.2%
11.0%
11.7%
11.5%
11.9%
13.3%
11.5%
11.4%
High
TUDORPICKERING
HOLT&COI:
ENERGY INVESTIMENT
MERCHANT BANKING
1.02
2.9%
6.0%
9.1%
85View entire presentation