Bank of America Investment Banking Pitch Book
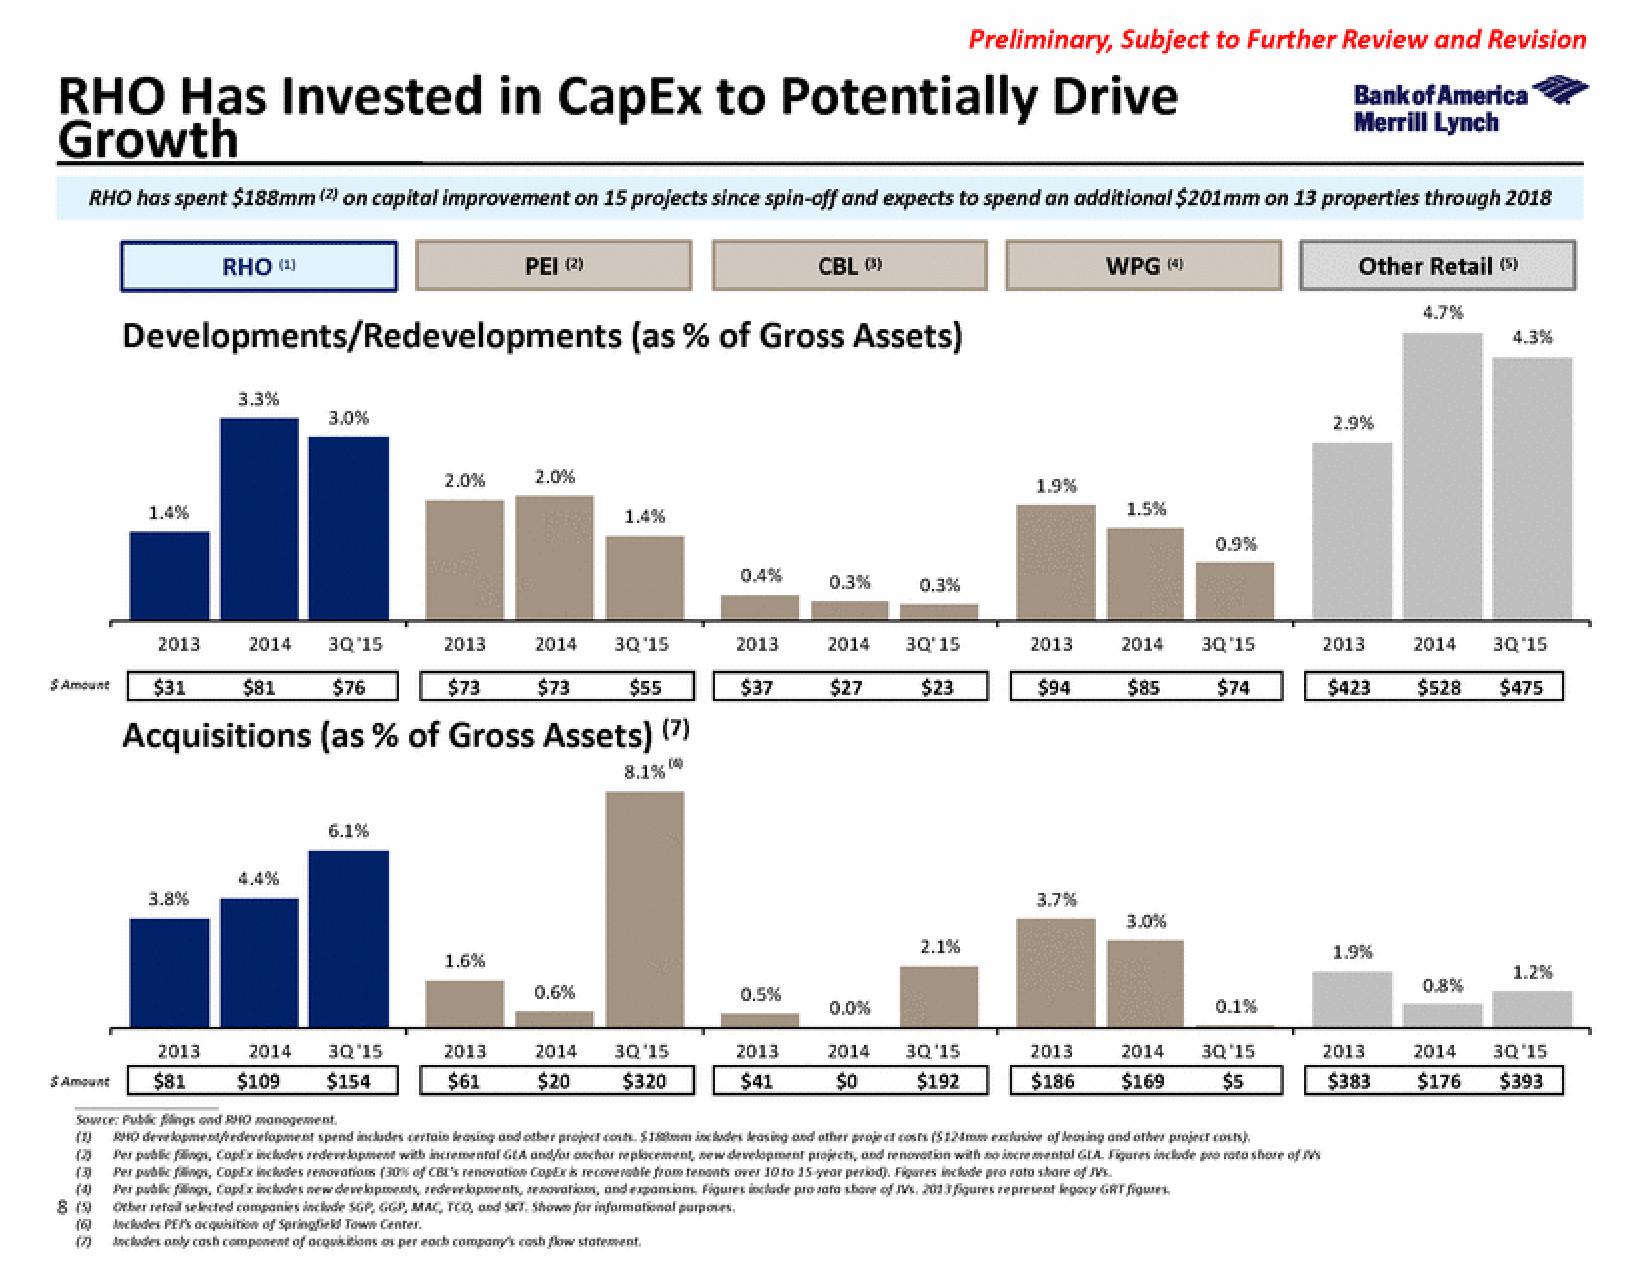
RHO Has Invested in CapEx to Potentially Drive
Growth
RHO has spent $188mm (2) on capital improvement on 15 projects since spin-off and expects to spend an additional $201mm on 13 properties through 2018
$ Amount
$Amount
8888888
(3)
8 (9)
1.4%
2013
Developments/Redevelopments (as % of Gross Assets)
RHO (¹)
$31
3.8%
3.3%
$81
3.0%
2014 3Q'15
$76
$55
Acquisitions (as % of Gross Assets) (7)
(4)
4.4%
6.1%
2013
$73
2013
2014
3Q'15
$81 $109 $154
PEI (2)
1.6%
2013
$61
2.0%
2014 3Q'15
$73
1.4%
0.6%
2014
$20
8.1%
3Q'15
$320
2013
$37
0.5%
CBL (5)
2013
$41
0.3%
2014
$27
0.0%
0.3%
3Q'15
$23
2.1%
Preliminary, Subject to Further Review and Revision
Bank of America
Merrill Lynch
2014 30'15
$0
$192
1.9%
2013
$94
3.7%
2013
$186
WPG (4)
1.5%
2014
$85
3.0%
2014
$169
0.9%
3Q'15
$74
Source: Public fings and RHO management.
(0) RHO development/redevelopment spend includes certain leasing and other project cost $1m includes leasing and other project costs (5124mm exclusive of leasing and other project costs).
Per public fing, CopEx includes redevelopment with incremental GA and/or anchor replacement, new development project, and renovation with no incremental GLA. Figures include pro roto shore of m
Per public fings, CopEx includes renovations (30% of CBL's renovation CopEr is recoverable from tenonts over 10 to 15 year period). Figures include pro roto share of s
Per public, Copfx includes new developments, redevelopments, renovations, and expansions Figures include pro rato shove of Vs. 2013 figures represent legacy GRT figures
Orber retail selected companies include SGP, GGP, MAC, TOO, and SKT. Shown for informational purposes.
Includes PEP's acquisition of Springfield Town Center.
Includes only cash component of acquisitions as per each company's cash flow statement.
0.1%
3Q'15
$5
Other Retail (5)
2013
1.9%
$423 $528
2013
4.7%
$383
2014 3Q'15
4.3%
0.8%
$475
1.2%
2014
30 15
$176 $393View entire presentation