Truist Financial Corp Results Presentation Deck
Non-GAAP reconciliations
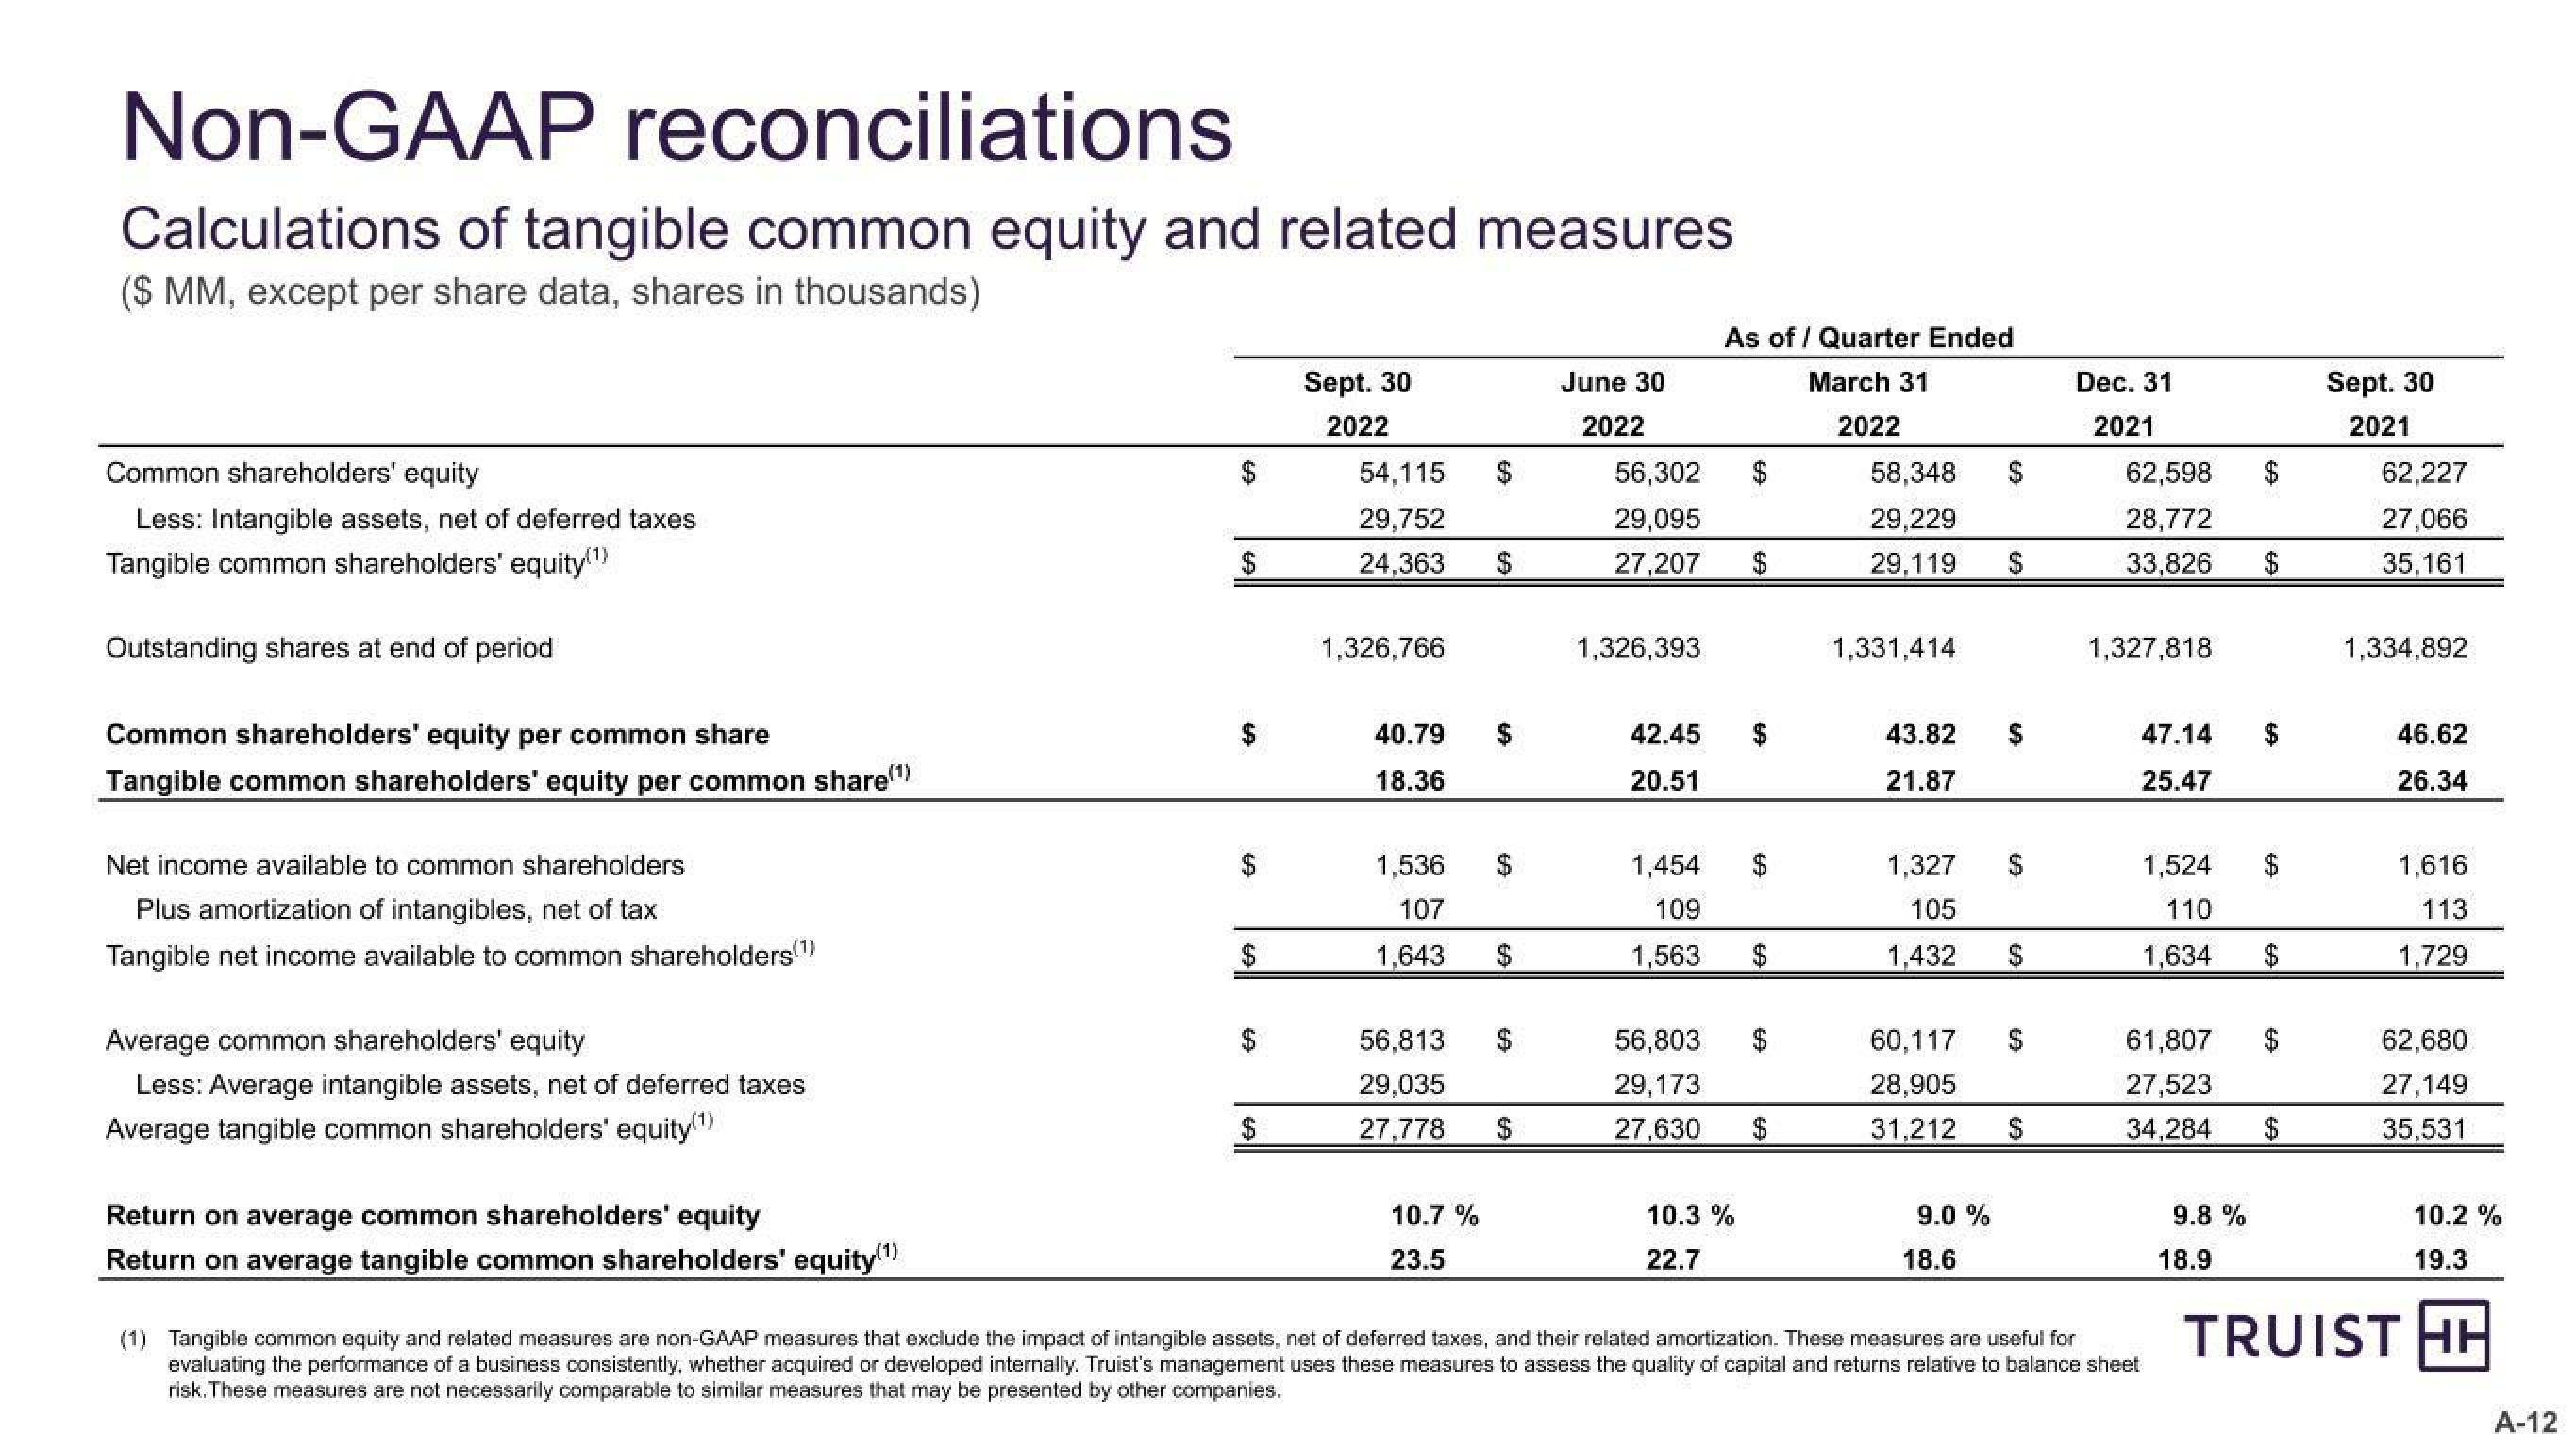
Calculations of tangible common equity and related measures
($ MM, except per share data, shares in thousands)
Common shareholders' equity
Less: Intangible assets, net of deferred taxes
Tangible common shareholders' equity(¹)
Outstanding shares at end of period
Common shareholders' equity per common share
Tangible common shareholders' equity per common share(¹)
Net income available to common shareholders
Plus amortization of intangibles, net of tax
Tangible net income available to common shareholders(¹)
Average common shareholders' equity
Less: Average intangible assets, net of deferred taxes
Average tangible common shareholders' equity(¹)
Return on average common shareholders' equity
Return on average tangible common shareholders' equity(¹)
69
$
$
Sept. 30
2022
54,115
29,752
24,363
1,326,766
40.79
18.36
1,536
107
1,643
56,813
29,035
27,778
10.7 %
23.5
69
$
$
June 30
2022
56,302
29,095
27,207
1,326,393
42.45
20.51
1,454
109
1,563
56,803
29,173
27,630
As of/ Quarter Ended
March 31
2022
10.3 %
22.7
$
58,348
29,229
29,119
1,331,414
43.82 $
21.87
1,327 $
105
1,432
60,117
28,905
31,212
9.0 %
18.6
$
$
Dec. 31
2021
62,598
28,772
33,826
1,327,818
47.14
25.47
1,524
110
1,634
61,807
27,523
34,284
(1) Tangible common equity and related measures are non-GAAP measures that exclude the impact of intangible assets, net of deferred taxes, and their related amortization. These measures are useful for
evaluating the performance of a business consistently, whether acquired or developed internally. Truist's management uses these measures to assess the quality of capital and returns relative to balance sheet
risk. These measures are not necessarily comparable to similar measures that may be presented by other companies.
9.8 %
$
18.9
$
Sept. 30
2021
62,227
27,066
35,161
1,334,892
46.62
26.34
1,616
113
1,729
10.2 %
19.3
TRUIST HH
62,680
27,149
35,531
A-12View entire presentation