Altus Power Results Presentation Deck
Track Record of Growth
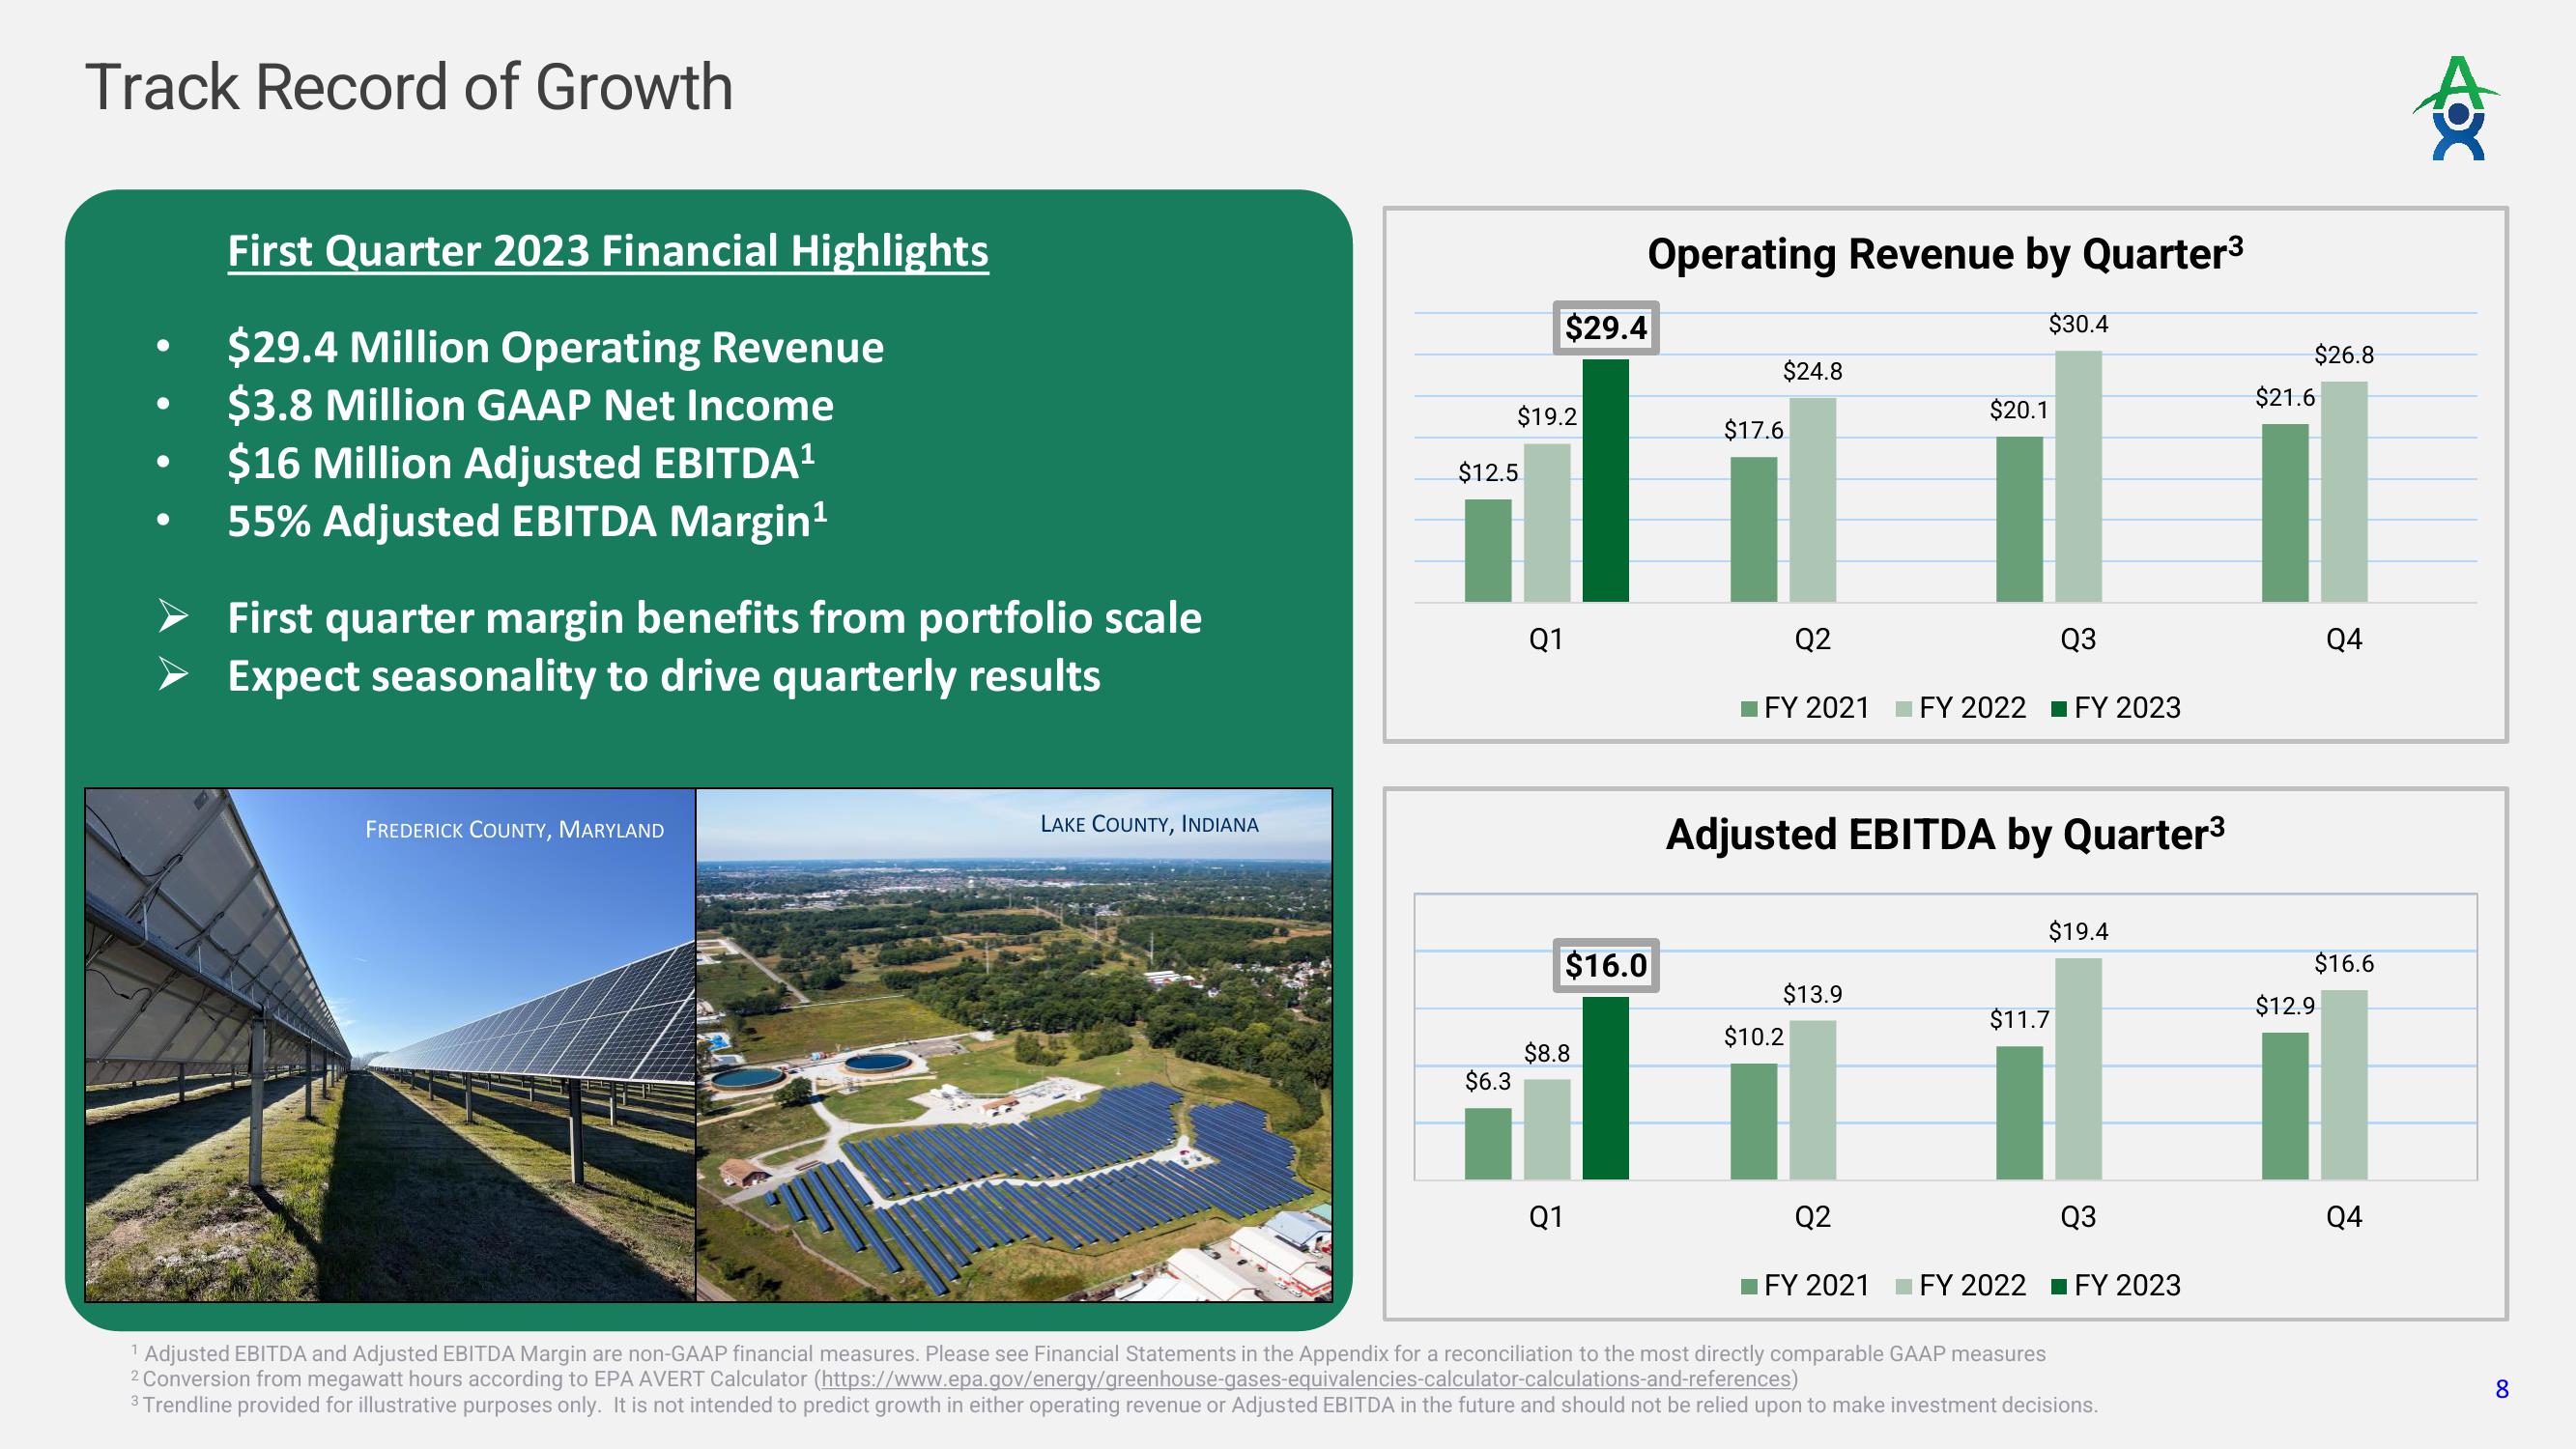
First Quarter 2023 Financial Highlights
$29.4 Million Operating Revenue
$3.8 Million GAAP Net Income
$16 Million Adjusted EBITDA¹
55% Adjusted EBITDA Margin¹
First quarter margin benefits from portfolio scale
Expect seasonality to drive quarterly results
FREDERICK COUNTY, MARYLAND
LAKE COUNTY, INDIANA
$12.5
$6.3
$19.2
Q1
$29.4
Operating Revenue by Quarter³
$16.0
$8.8
Q1
$24.8
$17.6
Q2
Q3
FY 2021 FY 2022 FY 2023
$13.9
$10.2
$20.1
Adjusted EBITDA by Quarter³
$30.4
Q2
$19.4
$11.7
Q3
FY 2021 FY 2022 ■ FY 2023
1 Adjusted EBITDA and Adjusted EBITDA Margin are non-GAAP financial measures. Please see Financial Statements in the Appendix for a reconciliation to the most directly comparable GAAP measures
2 Conversion from megawatt hours according to EPA AVERT Calculator (https://www.epa.gov/energy/greenhouse-gases-equivalencies-calculator-calculations-and-references)
3 Trendline provided for illustrative purposes only. It is not intended to predict growth in either operating revenue or Adjusted EBITDA in the future and should not be relied upon to make investment decisions.
$26.8
$21.6
Q4
$16.6
$12.9
Q4
tox
8View entire presentation