Investor Presentation
ENERGY & CLIMATE TECHNOLOGIES: GENERATION & TRADING (ENERJİSA ÜRETİM)
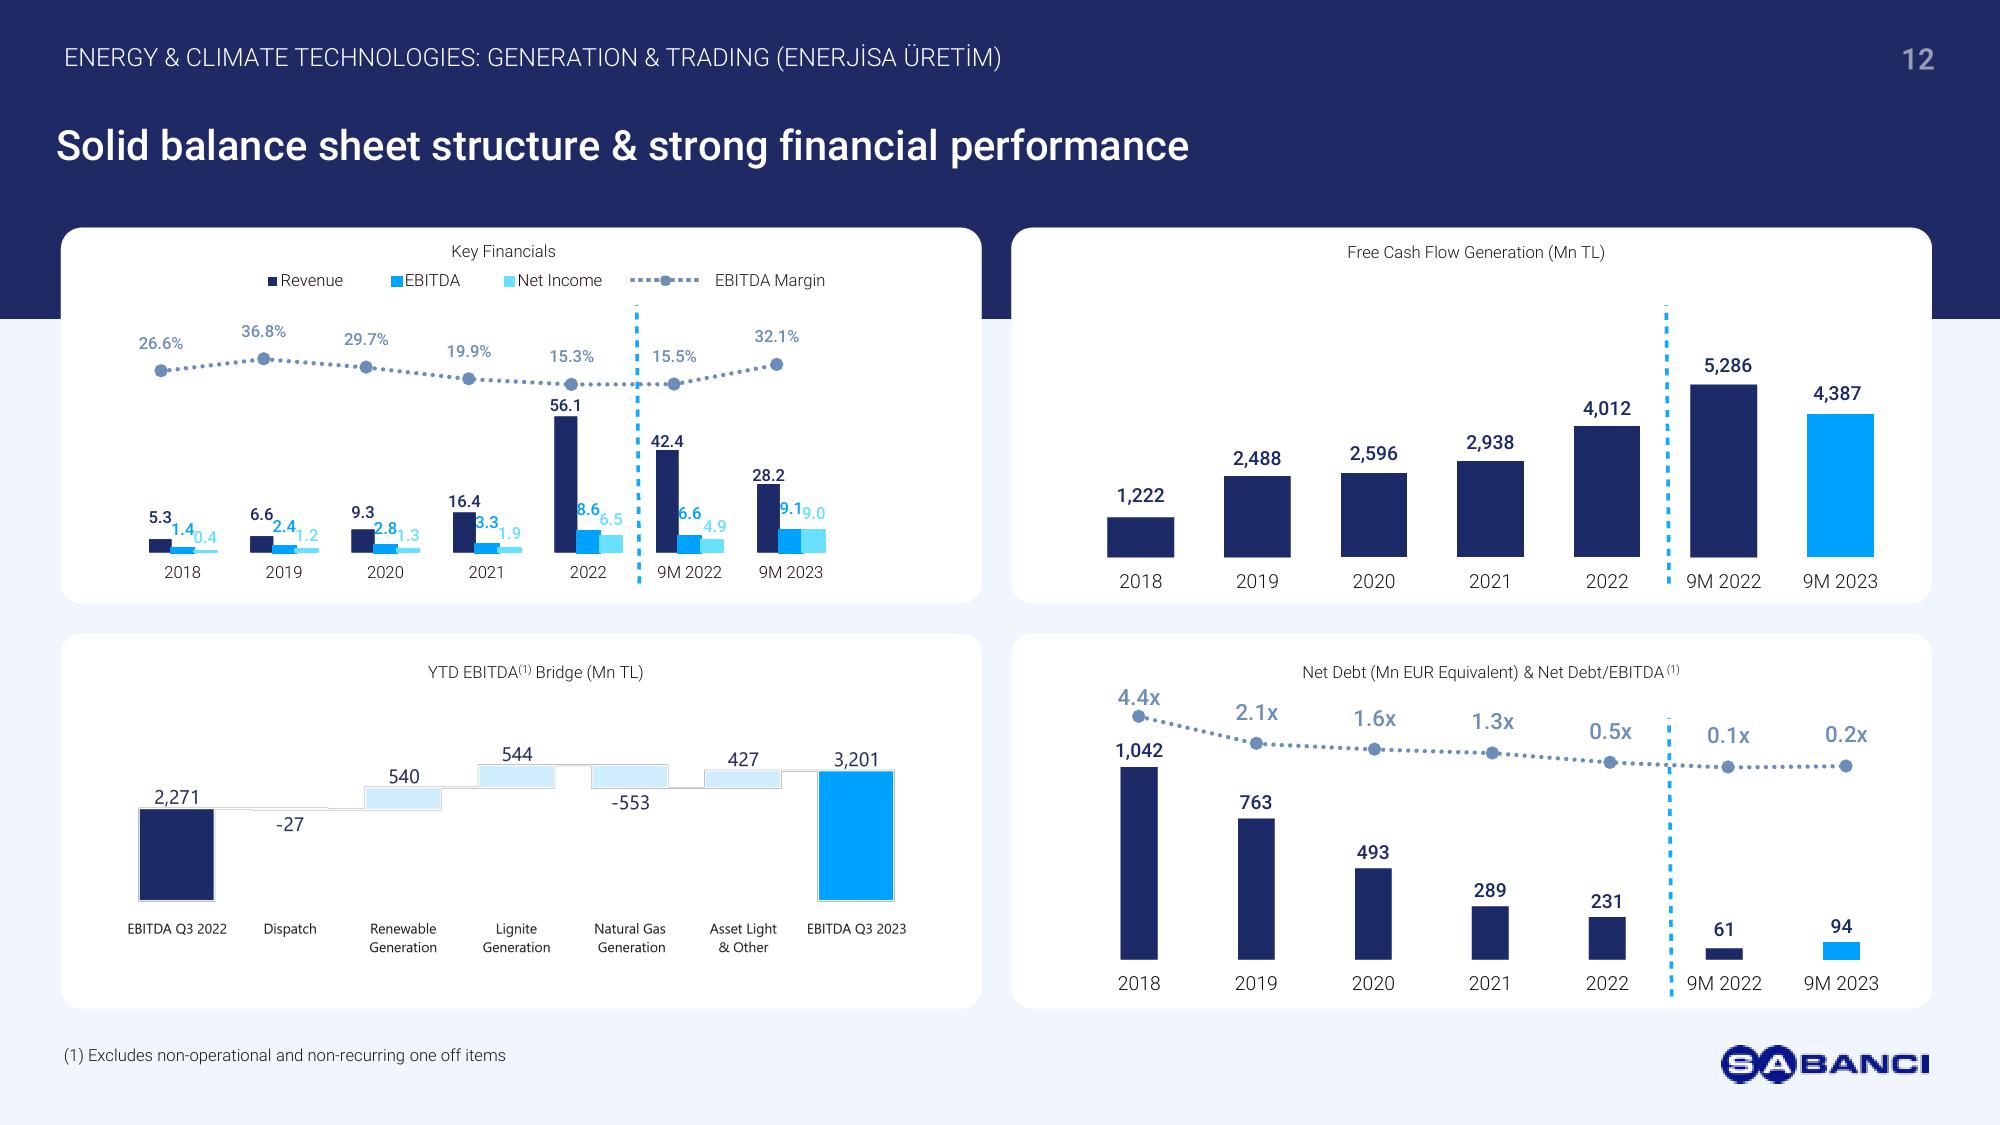
Solid balance sheet structure & strong financial performance
■Revenue
Key Financials
EBITDA
Net Income
EBITDA Margin
Free Cash Flow Generation (Mn TL)
36.8%
26.6%
29.7%
32.1%
19.9%
15.3%
■ 15.5%
5,286
4,387
56.1
42.4
LLL
4,012
2,938
2,488
2,596
28.2
1,222
6.6
9.19.0
4.9
5.3
1.40.4
6.6
2.41.2.
16.4
9.3
2
3.3
8.6
6.5
1.9
2018
2019
2020
2021
2022
9M 2022
9M 2023
2018
2019
2020
2021
2022
■ 9M 2022
9M 2023
YTD EBITDA (1) Bridge (Mn TL)
4.4x
2.1x
Net Debt (Mn EUR Equivalent) & Net Debt/EBITDA (1)
1.6x
1.3x
0.5x
0.1x
0.2x
1,042
544
427
3,201
540
763
2,271
-553
-27
EBITDA Q3 2022
Dispatch
Renewable
Generation
Lignite
Generation
Natural Gas
Generation
Asset Light
& Other
EBITDA Q3 2023
(1) Excludes non-operational and non-recurring one off items
493
289
231
61
94
2018
2019
2020
2021
2022
9M 2022
9M 2023
12
SABANCIView entire presentation