Netstreit Investor Presentation Deck
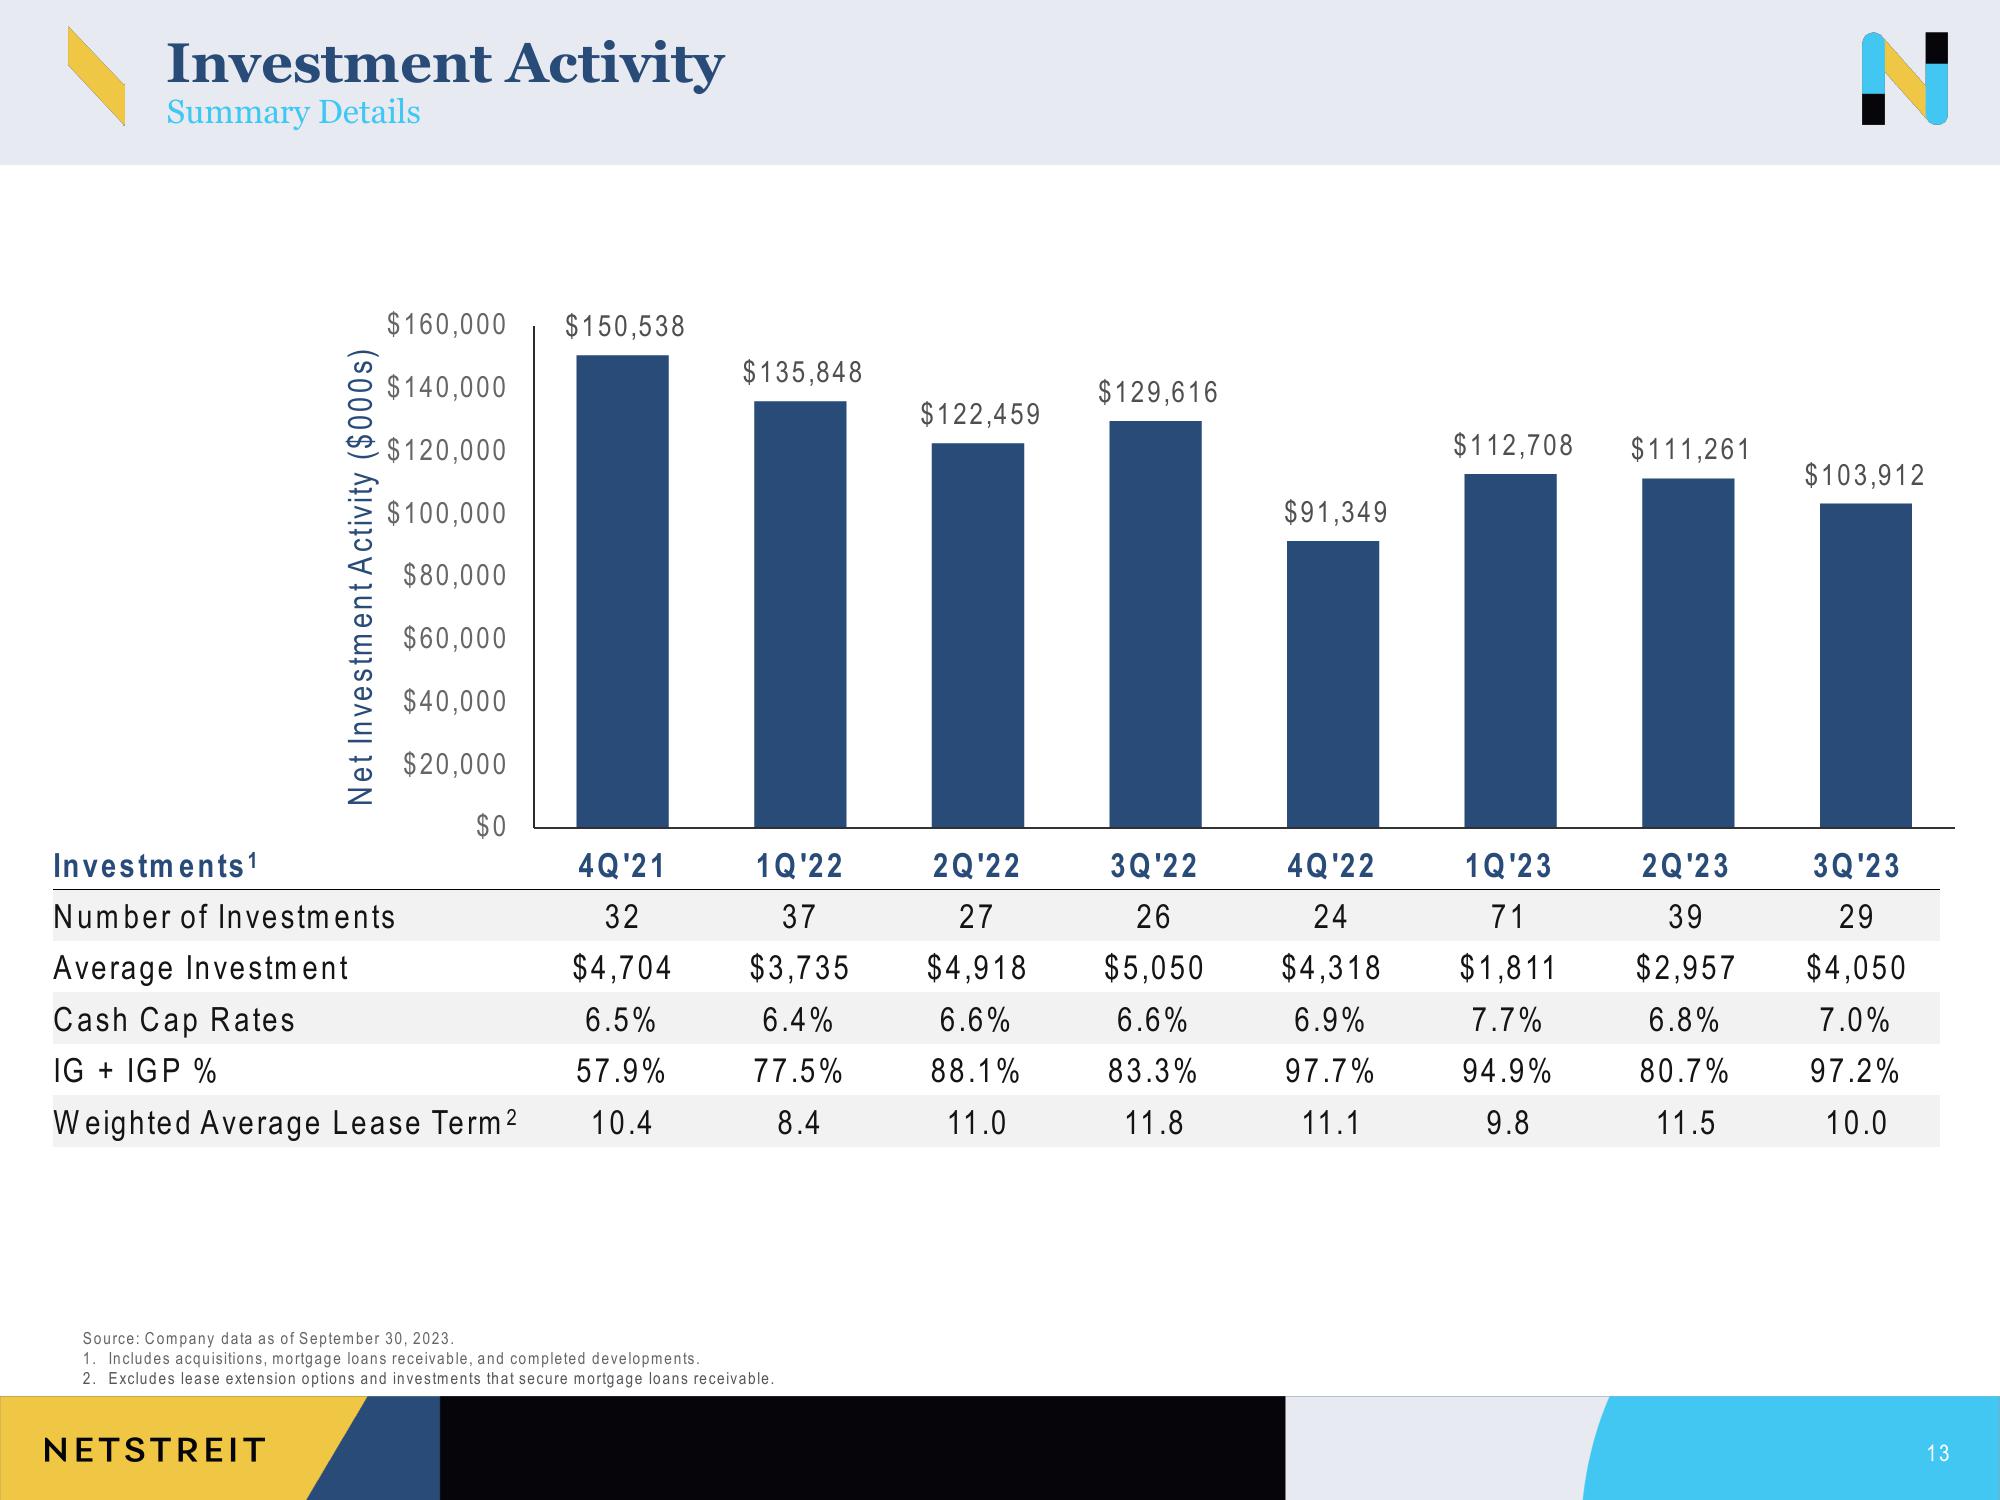
Investment Activity
Summary Details
Net Investment Activity ($000s)
$160,000 $150,538
$140,000
$120,000
$100,000
$80,000
$60,000
$40,000
$20,000
$0
Investments ¹
Number of Investments
Average Investment
Cash Cap Rates
IG + IGP %
Weighted Average Lease Term ²
NETSTREIT
4Q'21
32
$4,704
6.5%
57.9%
10.4
$135,848
1Q'22
37
$3,735
6.4%
77.5%
8.4
Source: Company data as of September 30, 2023.
1. Includes acquisitions, mortgage loans receivable, and completed developments.
2. Excludes lease extension options and investments that secure mortgage loans receivable.
$122,459
2Q¹22
27
$4,918
6.6%
88.1%
11.0
$129,616
3Q'22
26
$5,050
6.6%
83.3%
11.8
$91,349
4Q'22
24
$4,318
6.9%
97.7%
11.1
$112,708
1Q'23
71
$1,811
7.7%
94.9%
9.8
$111,261
2Q'23
39
$2,957
6.8%
80.7%
11.5
$103,912
3Q'23
29
$4,050
7.0%
97.2%
10.0
13View entire presentation