Crocs Results Presentation Deck
Financial Outlook
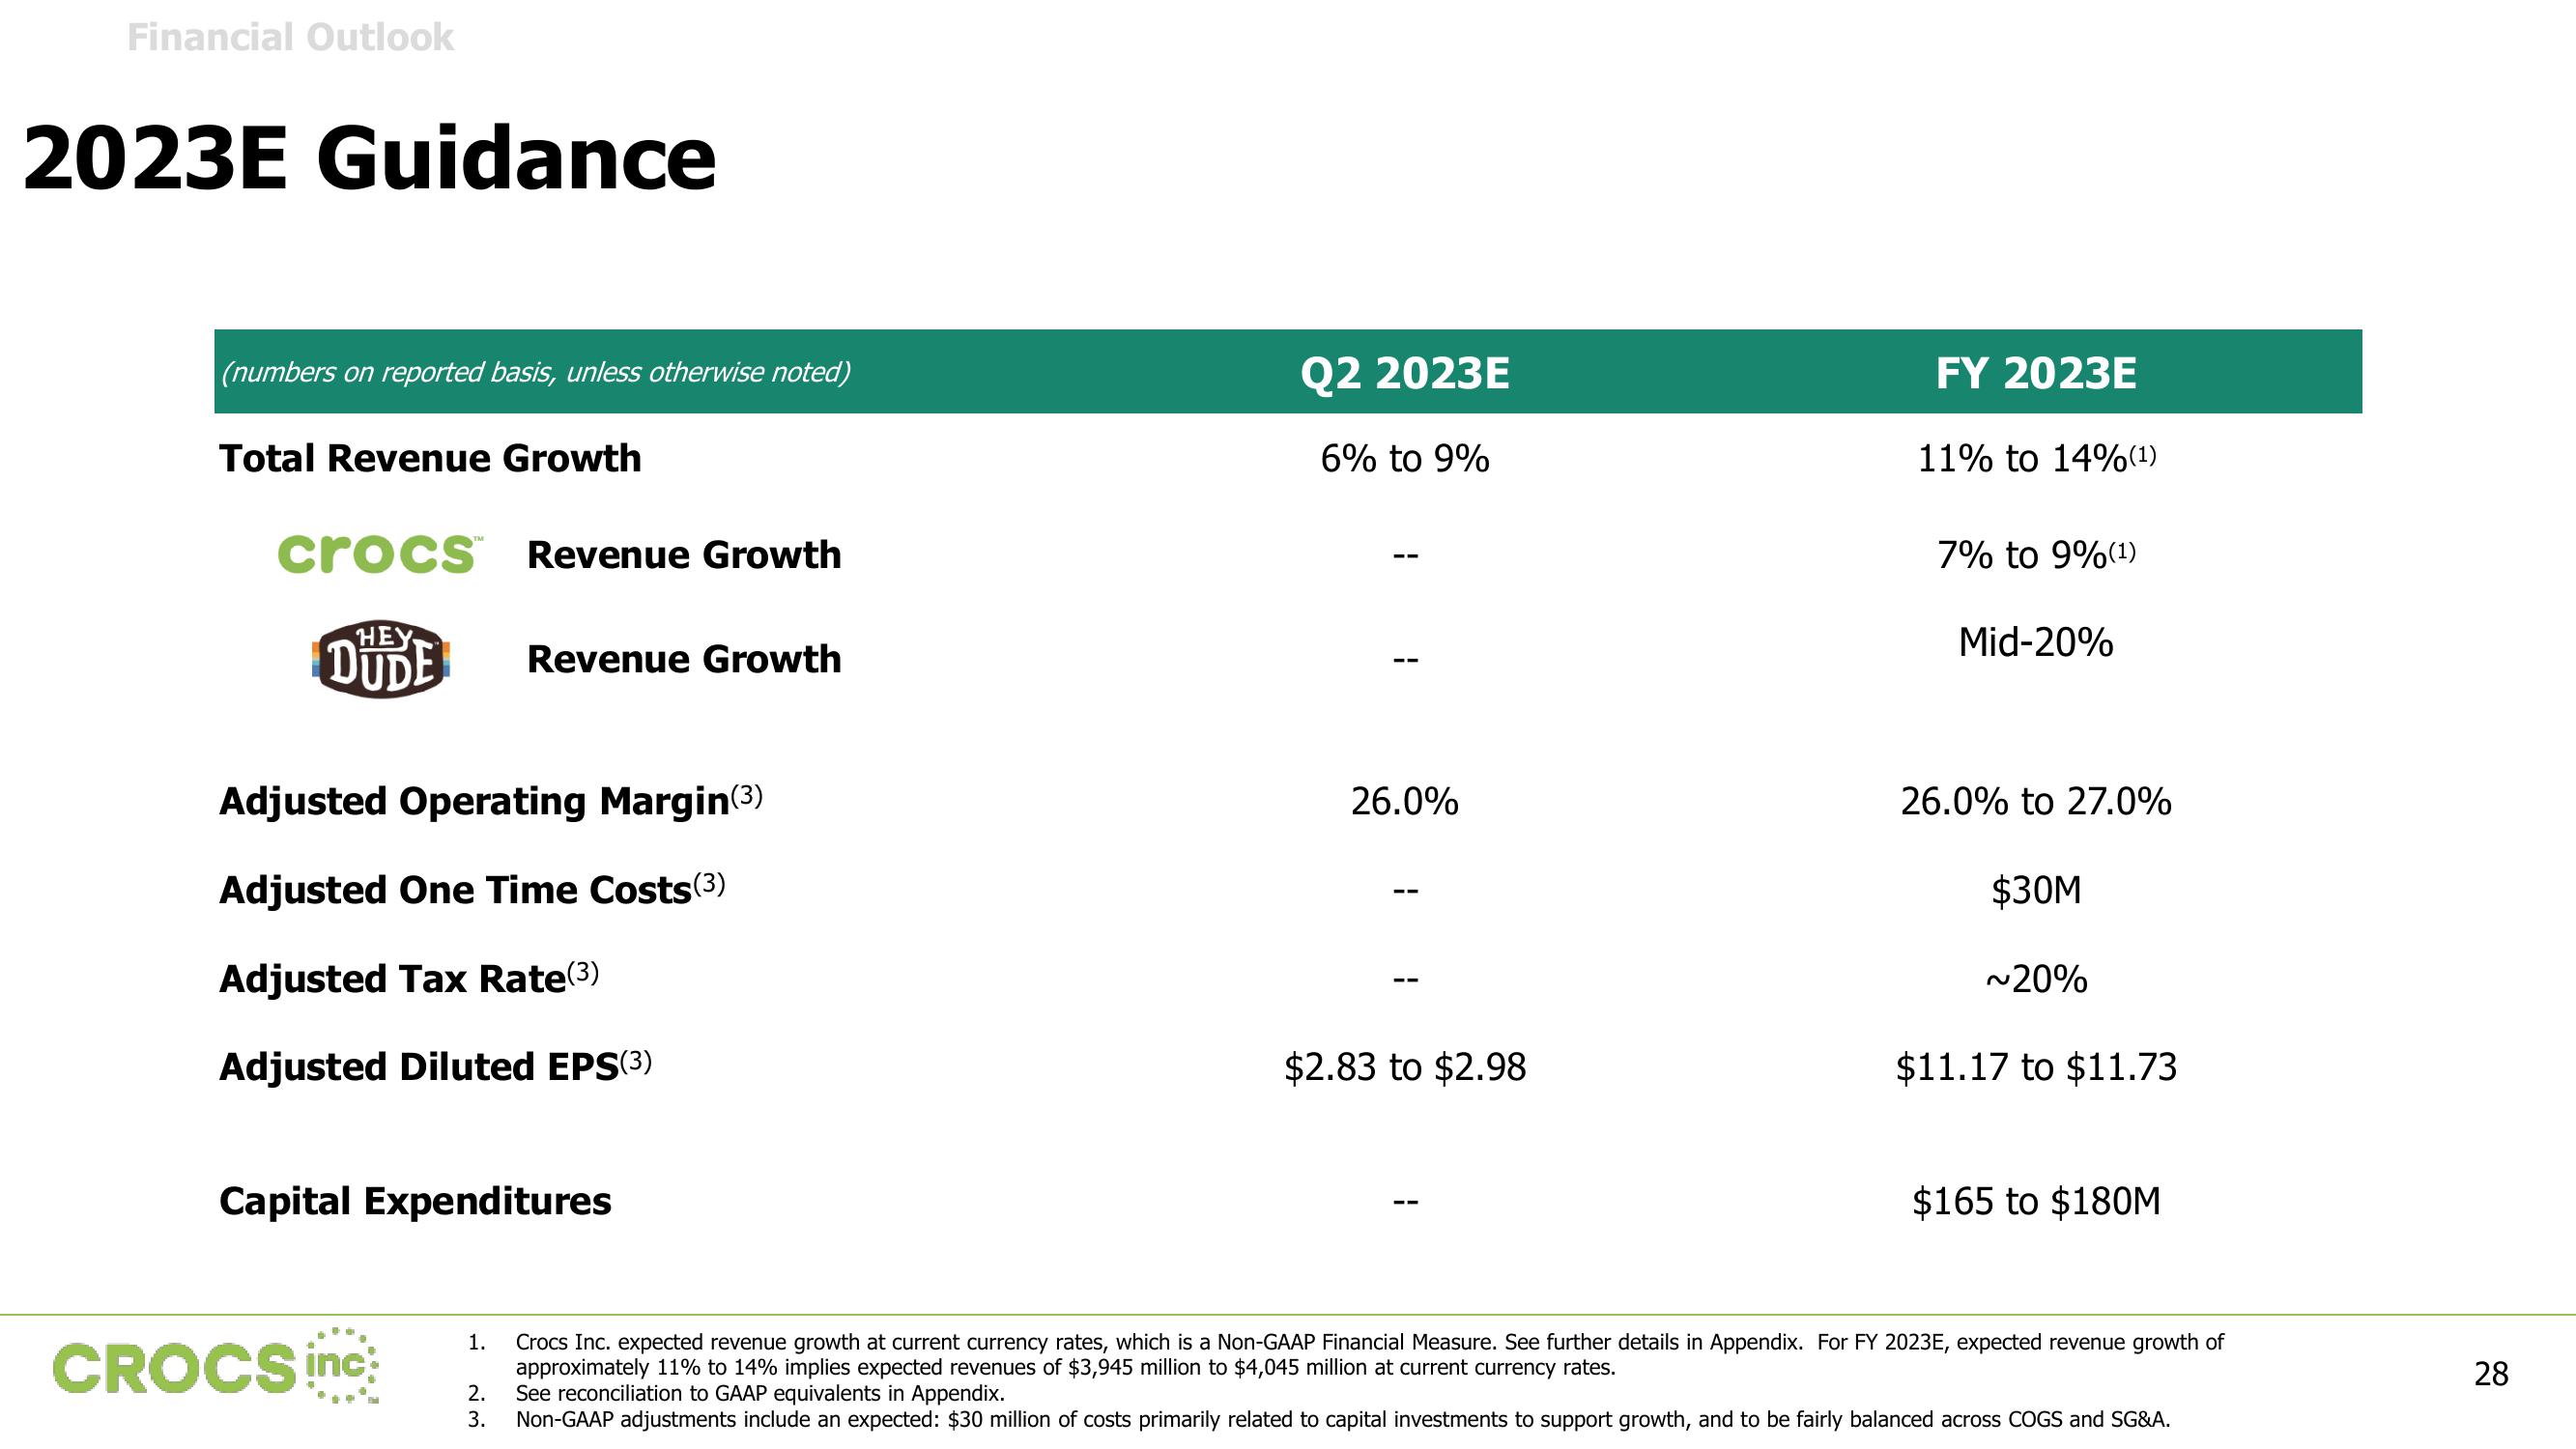
2023E Guidance
(numbers on reported basis, unless otherwise noted)
Total Revenue Growth
crocs Revenue Growth
HEY
DUDE
Adjusted Operating Margin(³)
Adjusted One Time Costs (3)
Adjusted Tax Rate(³)
Adjusted Diluted EPS(3)
Revenue Growth
Capital Expenditures
CROCS inc
1.
Q2 2023E
6% to 9%
1
26.0%
$2.83 to $2.98
FY 2023E
11% to 14% (¹)
7% to 9%(¹)
Mid-20%
26.0% to 27.0%
$30M
~20%
$11.17 to $11.73
$165 to $180M
Crocs Inc. expected revenue growth at current currency rates, which is a Non-GAAP Financial Measure. See further details in Appendix. For FY 2023E, expected revenue growth of
approximately 11% to 14% implies expected revenues of $3,945 million to $4,045 million at current currency rates.
2.
See reconciliation to GAAP equivalents in Appendix.
3. Non-GAAP adjustments include an expected: $30 million of costs primarily related to capital investments to support growth, and to be fairly balanced across COGS and SG&A.
28View entire presentation