Ashtead Group Results Presentation Deck
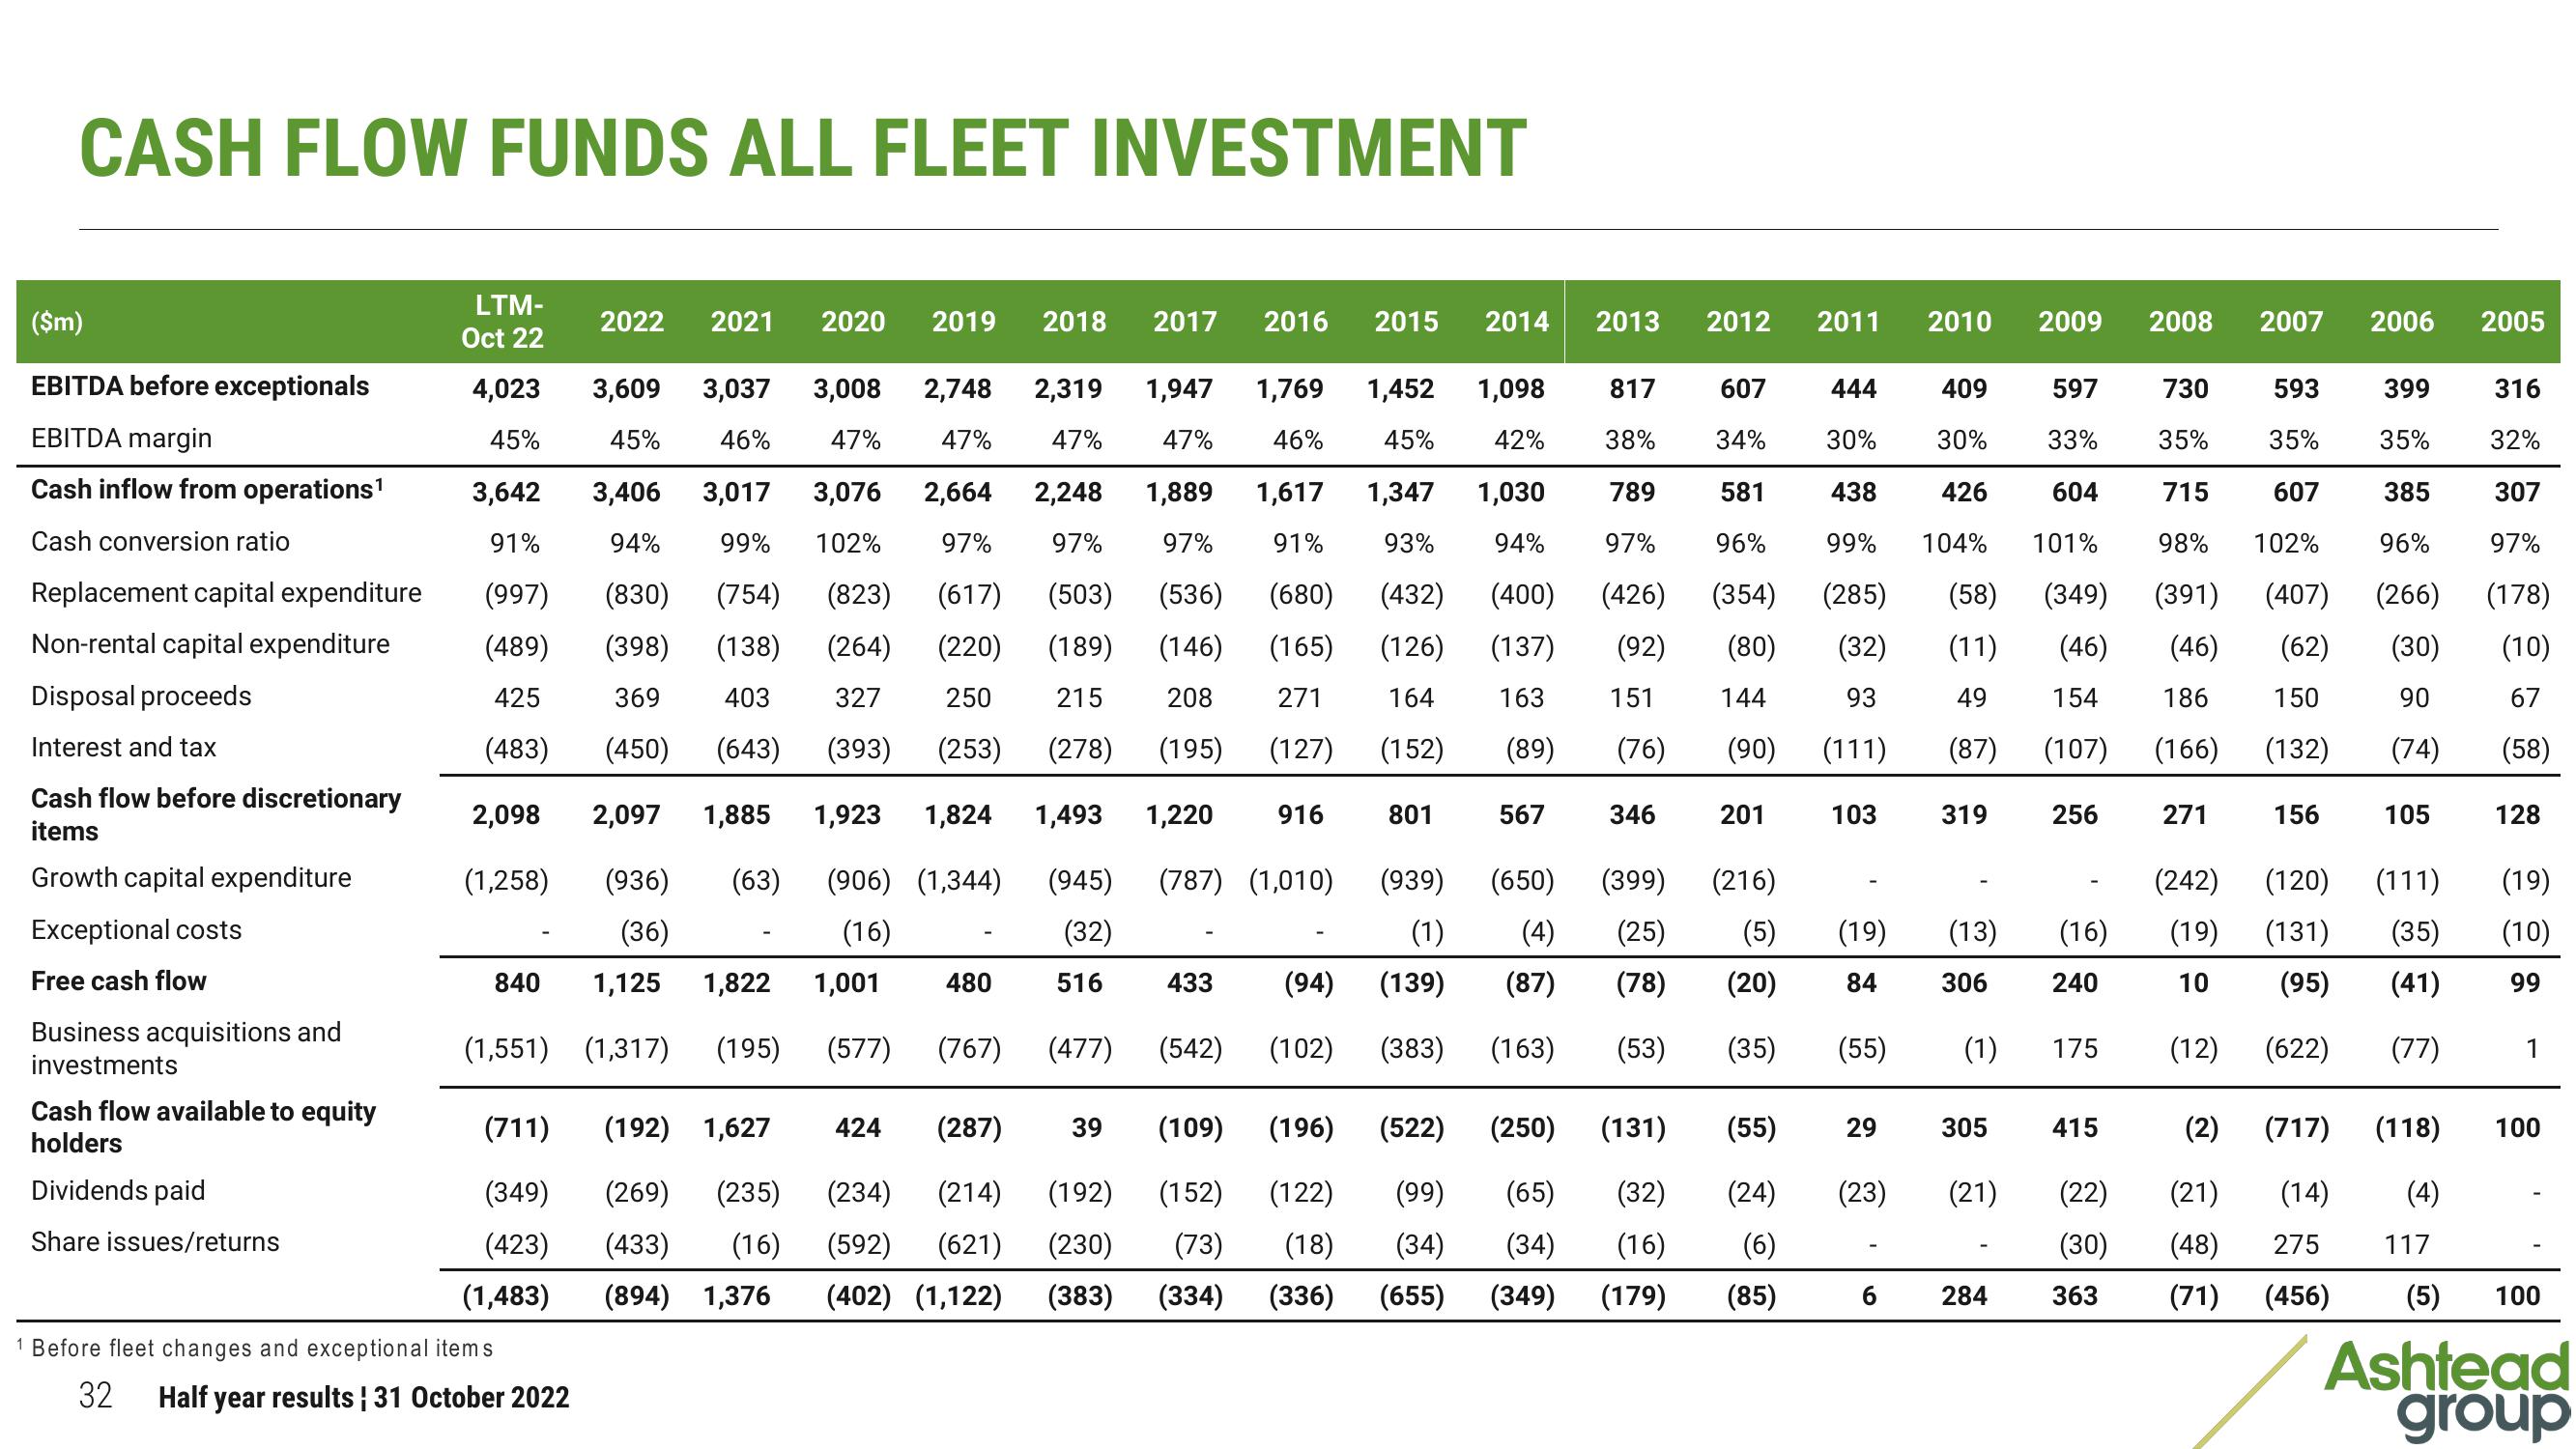
CASH FLOW FUNDS ALL FLEET INVESTMENT
($m)
EBITDA before exceptionals
EBITDA margin
Cash inflow from operations¹
Cash conversion ratio
Replacement capital expenditure
Non-rental capital expenditure
Disposal proceeds
Interest and tax
Cash flow before discretionary
items
Growth capital expenditure
Exceptional costs
Free cash flow
Business acquisitions and
investments
Cash flow available to equity
holders
Dividends paid
Share issues/returns
LTM-
Oct 22
4,023
45%
3,642
91%
(997)
(489)
425
(483)
2,098
(1,258)
840
1 Before fleet changes and exceptional items
2022 2021 2020 2019 2018
(1,551) (1,317) (195)
32 Half year results ¦ 31 October 2022
3,609
45%
(711) (192) 1,627
(349) (269) (235)
(423) (433) (16)
(1,483) (894) 1,376
3,037 3,008 2,748 2,319 1,947 1,769 1,452 1,098
46% 47% 47%
46% 45% 42%
3,017 3,076 2,664 2,248
47%
3,406
1,617 1,347 1,030
94%
99%
47%
1,889
102% 97%
97%
(823) (617) (503) (536)
(264) (220) (189) (146)
97%
91% 93% 94%
(680) (432) (400)
(830)
(754)
(398)
(138)
369
403
250
215
327
(393)
163
208
(253) (278) (195)
(165) (126) (137)
164
(152)
271
(127)
(450) (643)
2,097 1,885 1,923 1,824 1,493 1,220 916
(63) (906) (1,344) (945) (787) (1,010)
(936)
(36)
(16)
(32)
516
1,125 1,822 1,001
(577)
(767) (477)
480
424
2017 2016
39
433
(542)
(287)
(109)
(234) (214) (192) (152) (122)
(592) (621) (230) (73) (18)
(402) (1,122) (383) (334) (336)
2015 2014
801
(89)
(939)
567
2013
(76)
(650)
(399)
(1) (4) (25)
(94) (139)
(87)
(78)
(102) (383) (163) (53)
817
607
38%
34%
789
581
97% 96%
(426) (354) (285)
(92) (80) (32)
151
144
93
(90) (111)
346
2012 2011 2010
(196) (522) (250) (131)
201
(216)
(5)
(20)
(35)
444
30%
409
30%
426
597
33%
438
604
99% 104% 101%
(349)
(46)
154
(107)
103
(19)
84
(55)
(55)
(99) (65) (32) (24) (23)
(34) (34) (16) (6)
(655) (349) (179) (85)
29
6
(58)
(11)
49
(87)
319
(13)
306
305
2009
(21)
284
256
(1) 175
(16)
240
2008 2007 2006
415
730
35%
(407)
715
98%
(391)
(46) (62)
186 150
(166) (132)
156
271
593
35%
607
102%
(2) (717)
(22) (21) (14)
(30) (48)
363 (71)
316
399
35%
32%
385
307
97%
96%
(266)
(178)
(30) (10)
67
90
(74)
(58)
105
(242) (120) (111)
(19) (131) (35)
10 (95)
(41)
(12) (622)
(77)
2005
128
(19)
(10)
99
1
(118) 100
(4)
275 117
(456) (5) 100
Ashtead
groupView entire presentation