LanzaTech SPAC Presentation Deck
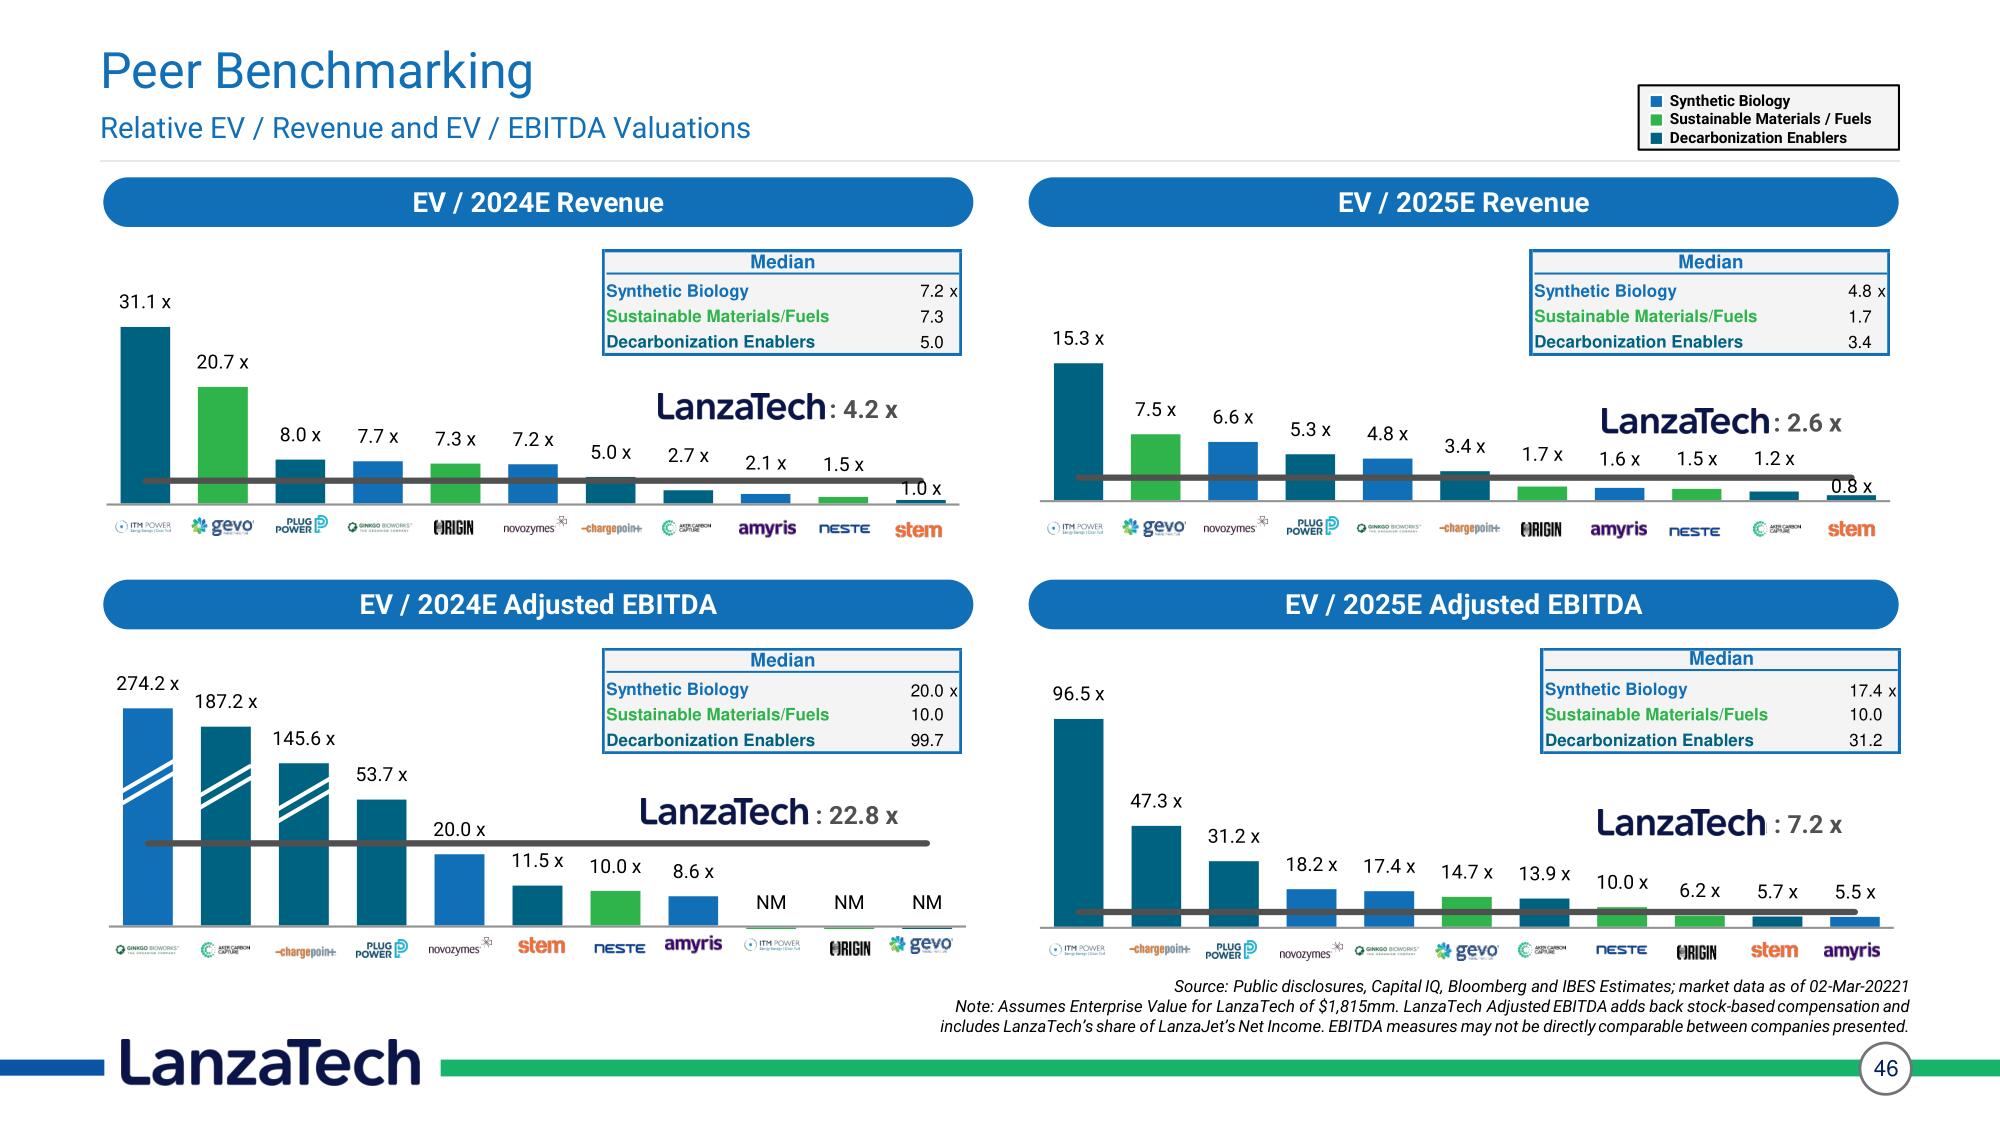
Peer Benchmarking
Relative EV / Revenue and EV / EBITDA Valuations
31.1 x
274.2 x
20.7 x
ITM POWER *gevo POWER
GINKGO BIOWORKS
8.0 x
ARTA CARBON
7.7 x
187.2 x
145.6 x
53.7 x
Hi
-chargepoin+
EV / 2024E Revenue
ONGO BOWORKS ORIGIN
POWER
7.3 x
LanzaTech
20.0 x
novozymes
7.2 X
$
$
EV / 2024E Adjusted EBITDA
novozymes -chargepoin+
11.5 x
Synthetic Biology
Sustainable Materials/Fuels
Decarbonization Enablers
5.0 X
stem
LanzaTech: 4.2 x
2.7 X
10.0 X
Median
8.6 x
2.1 X
NESTE amyris
Synthetic Biology
Sustainable Materials/Fuels
Decarbonization Enablers
Median
LanzaTech: 2
1.0 x
amyris NESTE stem
1.5 x
NM
(ITH POR
: 22.8 x
7.2 x
7.3
5.0
NM
20.0 x
10.0
99.7
NM
ORIGIN gevo
15.3 x
ITM POWER
96.5 x
7.5 x
() ITM POWER
47.3 x
||
gevo novozymes
6.6 x
-chargepoin+
R
31.2 x
PLUG
POWER
5.3 x
PLUG 5
POWER
EV / 2025E Revenue
18.2 x
4.8 x
novozymes
GINKGO BIOWORKS
17.4 x
3.4 x
* GINKGO BIOWORKS
EV / 2025E Adjusted EBITDA
1.7 x
14.7 x
Synthetic Biology
Sustainable Materials/Fuels
Decarbonization Enablers
-chargepoin+ RIGIN amyris
1.6 x
LanzaTech: 2.6 x
1.5 x
1.2 x
13.9 x
Synthetic Biology
Sustainable Materials / Fuels
Decarbonization Enablers
Median
NESTE
Synthetic Biology
Sustainable Materials/Fuels
Decarbonization Enablers
Median
NESTE
10.0 X 6.2 X
LanzaTech:7
: 7.2 x
5.7 x
gevo
ORIGIN
stem amyris
Source: Public disclosures, Capital IQ, Bloomberg and IBES Estimates; market data as of 02-Mar-20221
Note: Assumes Enterprise Value for LanzaTech of $1,815mm. LanzaTech Adjusted EBITDA adds back stock-based compensation and
includes LanzaTech's share of LanzaJet's Net Income. EBITDA measures may not be directly comparable between companies presented.
46
4.8 x
1.7
3.4
0.8 x
stem
17.4 x
10.0
31.2
5.5 xView entire presentation