Melrose Mergers and Acquisitions Presentation Deck
Aerospace: overview
Melrose
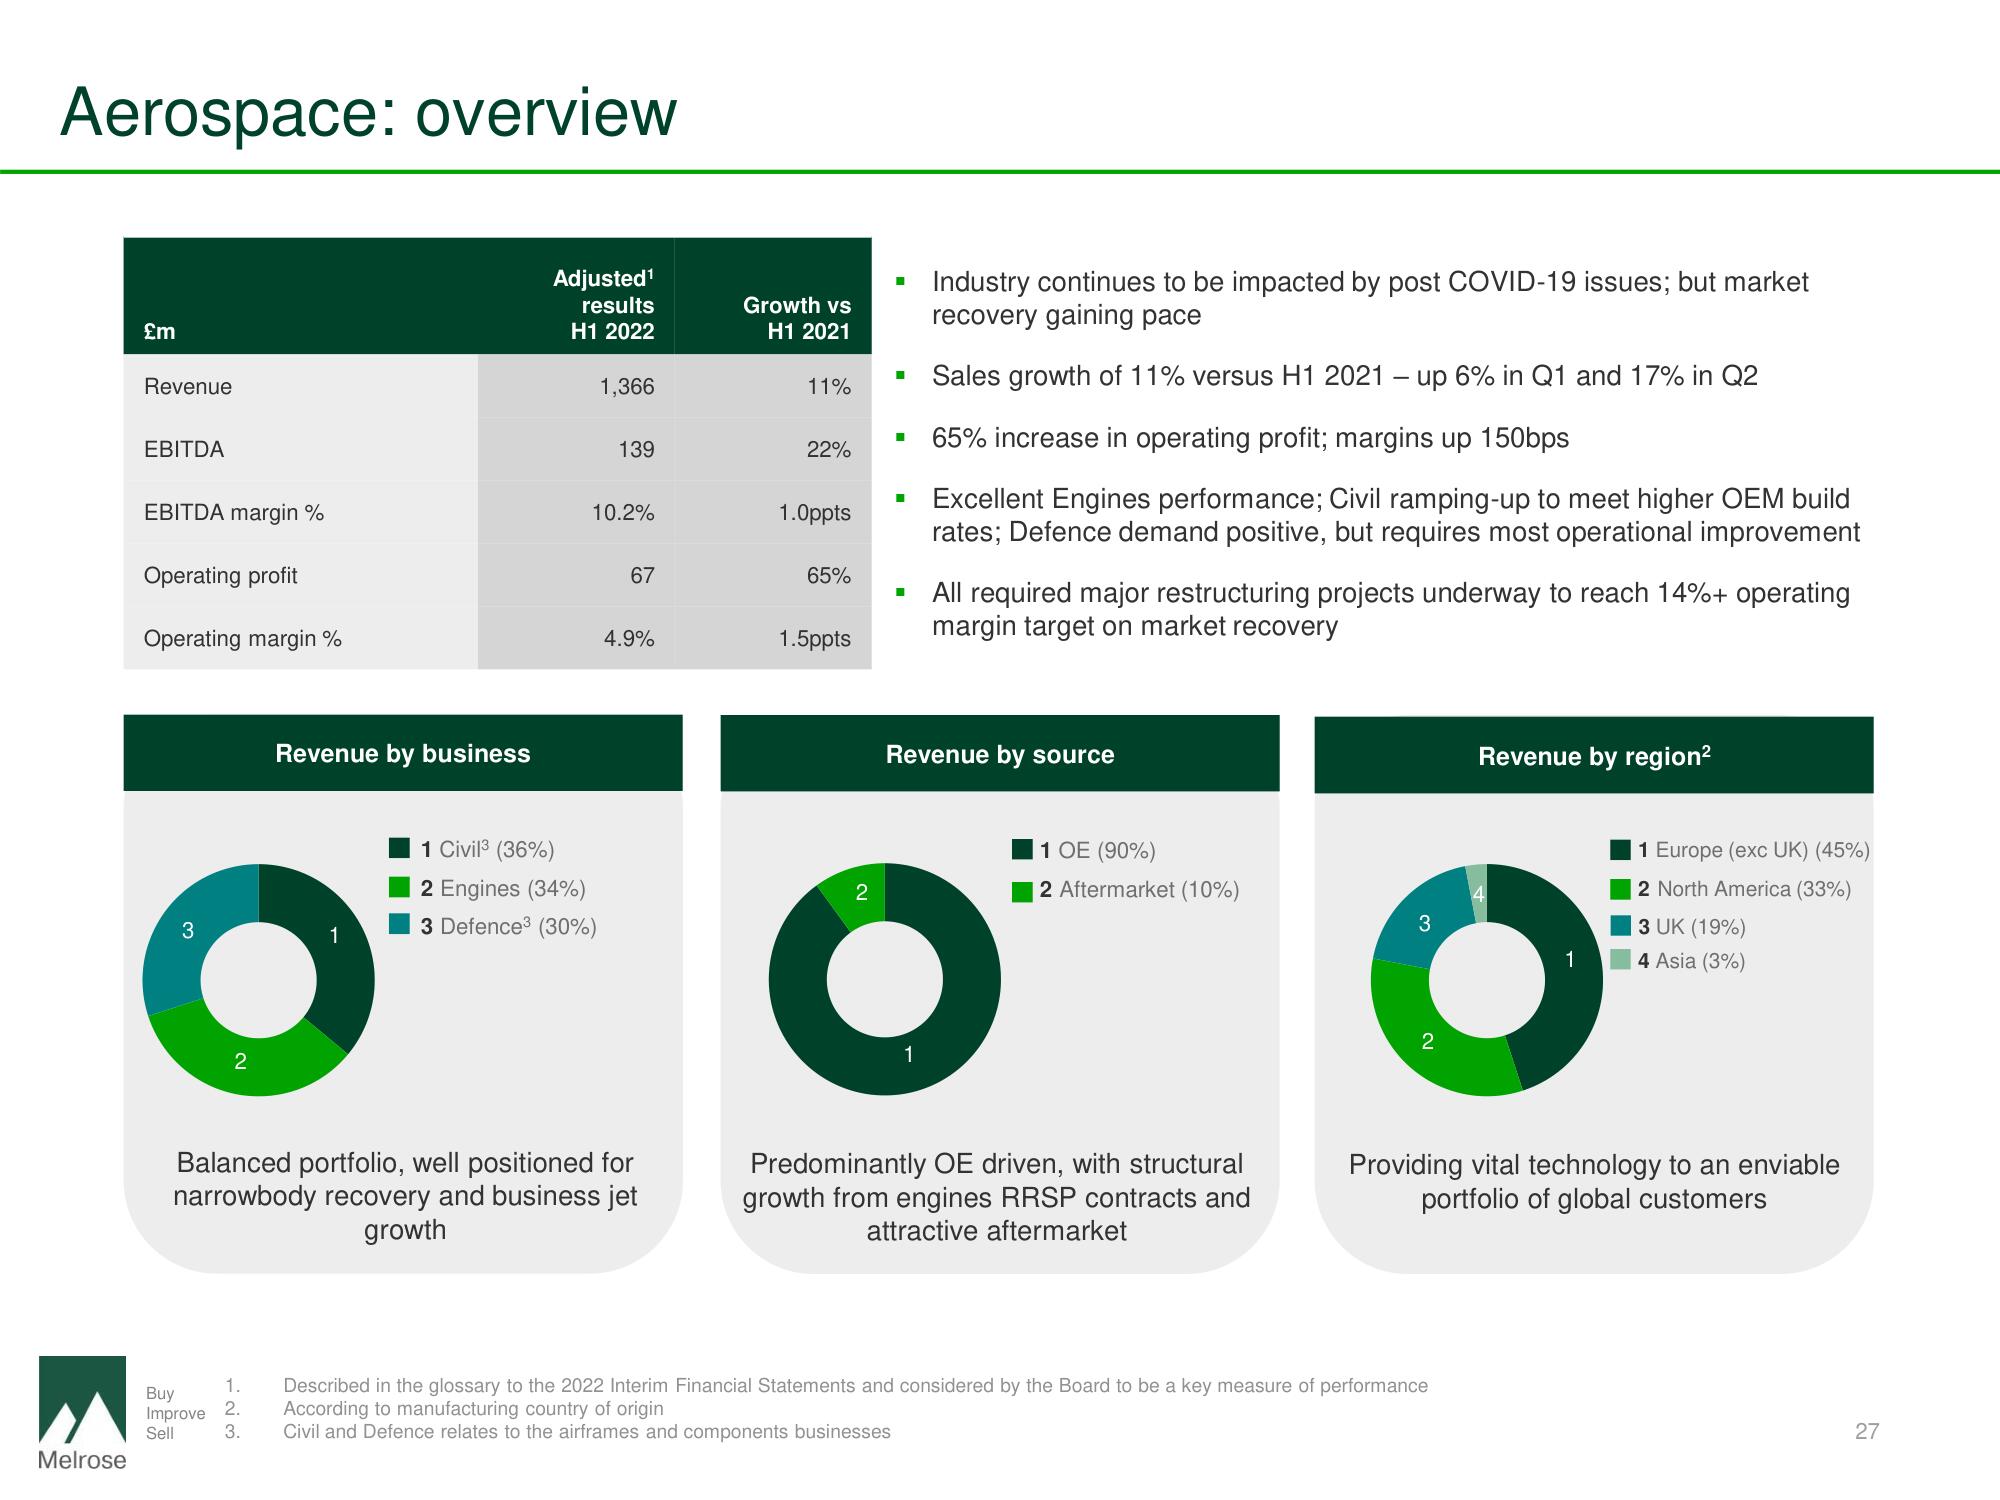
£m
Revenue
EBITDA
EBITDA margin %
Operating profit
Operating margin %
3
2
Buy
Improve
Sell
Revenue by business
1
123
Adjusted¹
results
H1 2022
1,366
1 Civil³ (36%)
2 Engines (34%)
3 Defence³ (30%)
139
10.2%
67
Balanced portfolio, well positioned for
narrowbody recovery and business jet
growth
4.9%
Growth vs
H1 2021
11%
22%
1.0ppts
65%
1.5ppts
■
2
■
Industry continues to be impacted by post COVID-19 issues; but market
recovery gaining pace
Sales growth of 11% versus H1 2021 - up 6% in Q1 and 17% in Q2
65% increase in operating profit; margins up 150bps
Excellent Engines performance; Civil ramping-up to meet higher OEM build
rates; Defence demand positive, but requires most operational improvement
All required major restructuring projects underway to reach 14%+ operating
margin target on market recovery
Revenue by source
●
1
1 OE (90%)
2 Aftermarket (10%)
Predominantly OE driven, with structural
growth from engines RRSP contracts and
attractive aftermarket
3
2
1. Described in the glossary to the 2022 Interim Financial Statements and considered by the Board to be a key measure of performance
According to manufacturing country of origin
3. Civil and Defence relates to the airframes and components businesses
Revenue by region²
1 Europe (exc UK) (45%)
2 North America (33%)
3 UK (19%)
4 Asia (3%)
Providing vital technology to an enviable
portfolio of global customers
27View entire presentation