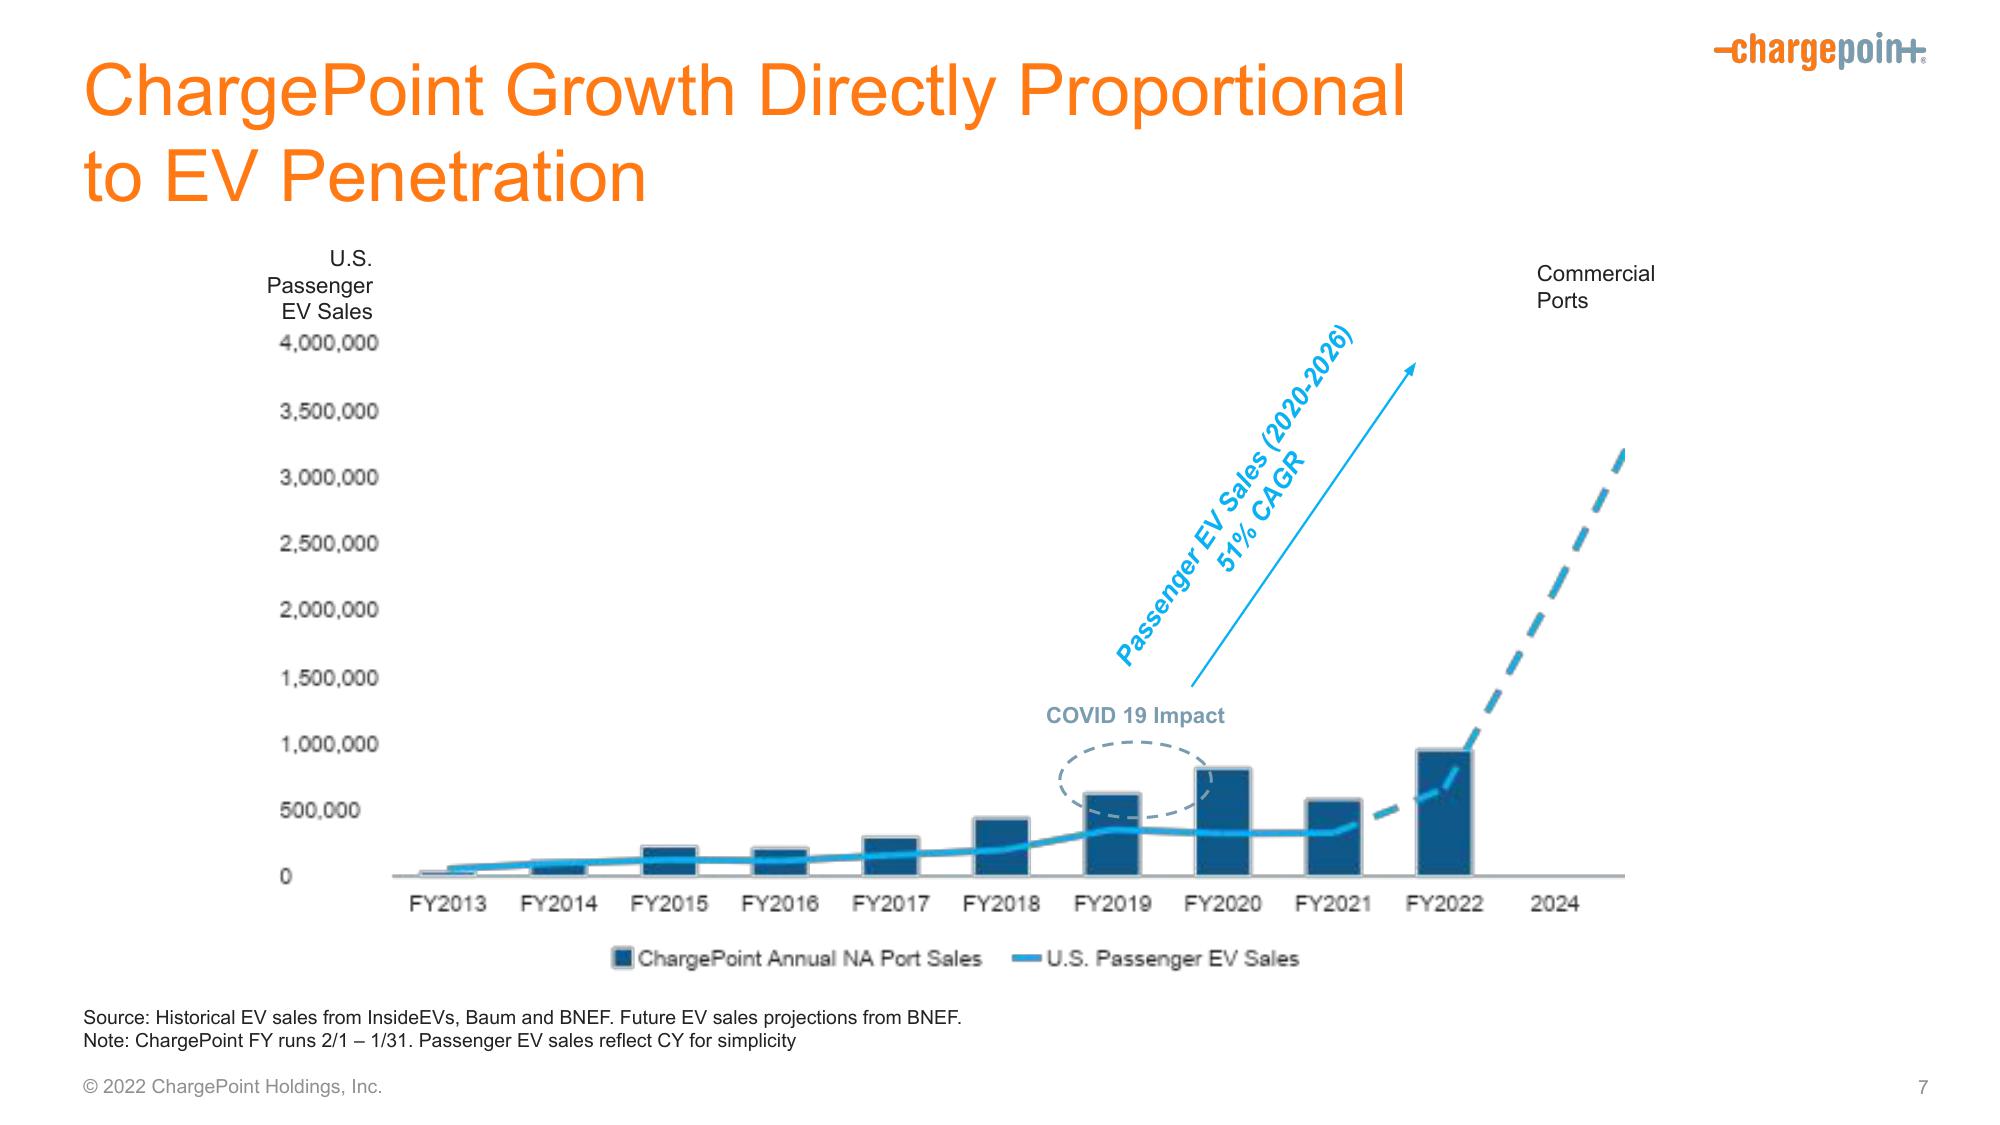
Driving the Electrification of Mobility
Categories
Finance PresentationsTechnology PresentationsBanking PresentationsInformation Technology PresentationsOil and Energy PresentationsInternet PresentationsMining and Metals PresentationsCommunications PresentationsReal Estate PresentationsBiotechnology PresentationsAutomotive PresentationsMedical PresentationsRetail PresentationsEnergy Presentations