Livent Corporation Investor Presentation
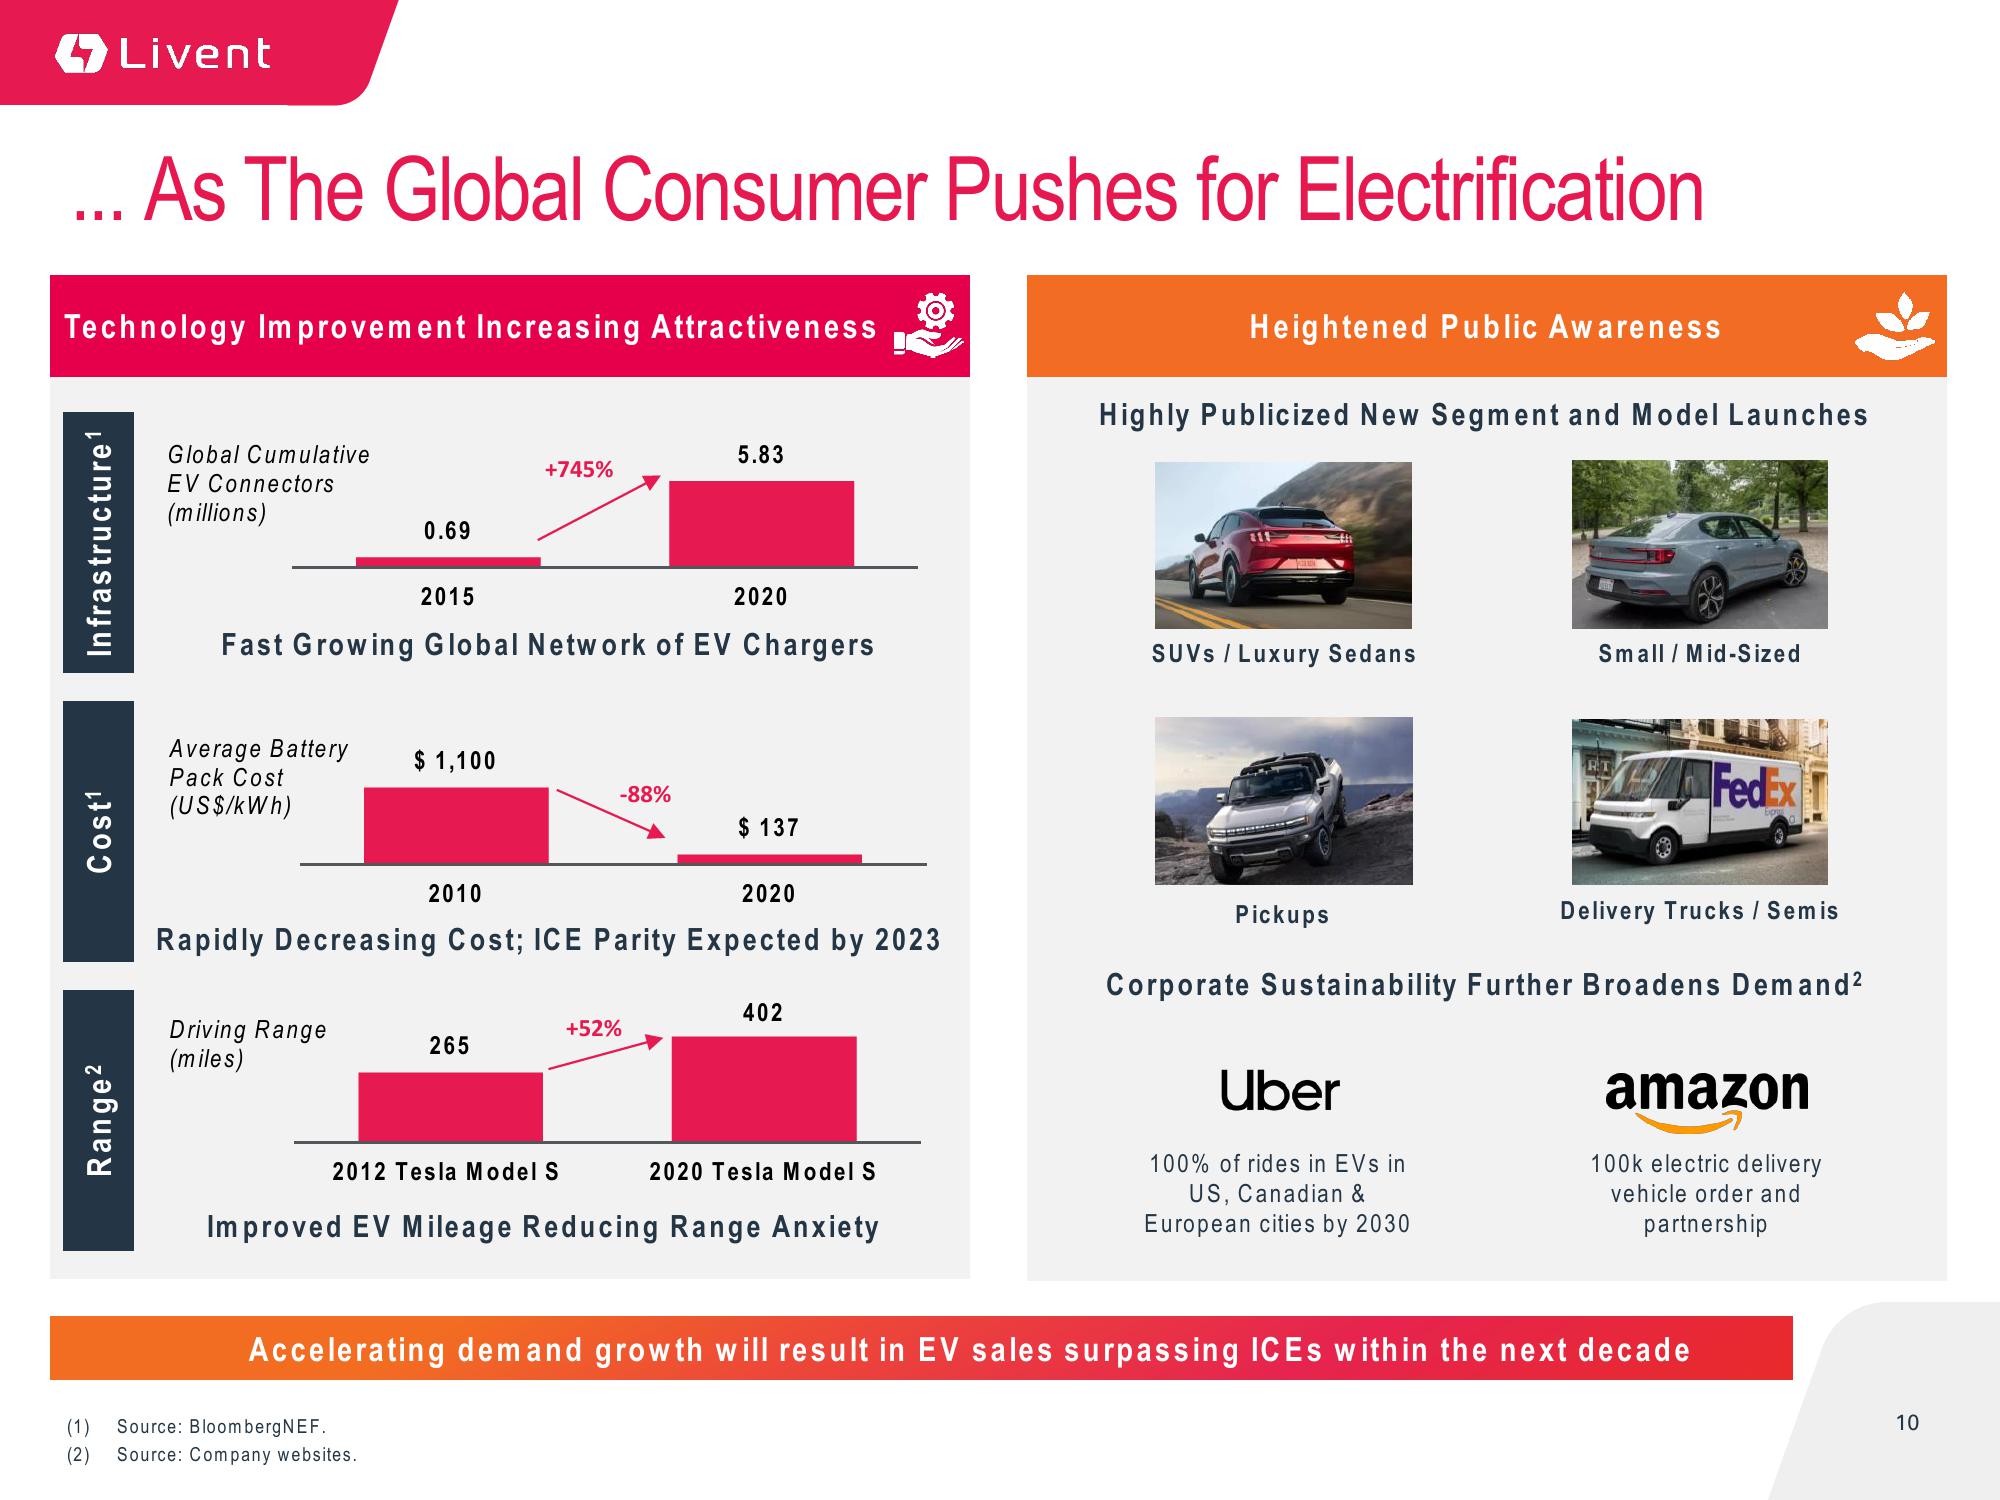
...As The Global Consumer Pushes for Electrification
Technology Improvement Increasing Attractiveness
Infrastructure ¹
Livent
Cost¹
Range²
Global Cumulative
EV Connectors
(millions)
0.69
Average Battery $ 1,100
Pack Cost
(US$/kWh)
Driving Range
(miles)
2015
Fast Growing Global Network of EV Chargers
+745%
265
(1) Source: BloombergNEF.
(2) Source: Company websites.
-88%
5.83
2010
2020
Rapidly Decreasing Cost; ICE Parity Expected by 2023
2020
+52%
$ 137
402
2012 Tesla Model S
2020 Tesla Model S
Improved EV Mileage Reducing Range Anxiety
Heightened Public Awareness
Highly Publicized New Segment and Model Launches
SUVS / Luxury Sedans
Pickups
Small / Mid-Sized
Uber
100% of rides in EVs in
US, Canadian &
European cities by 2030
FedEx
Delivery Trucks / Semis
Corporate Sustainability Further Broadens Demand²
Accelerating demand growth will result in EV sales surpassing ICEs within the next decade
amazon
100k electric delivery
vehicle order and
partnership
10View entire presentation