Credit Suisse Investment Banking Pitch Book
CONFIDENTIAL
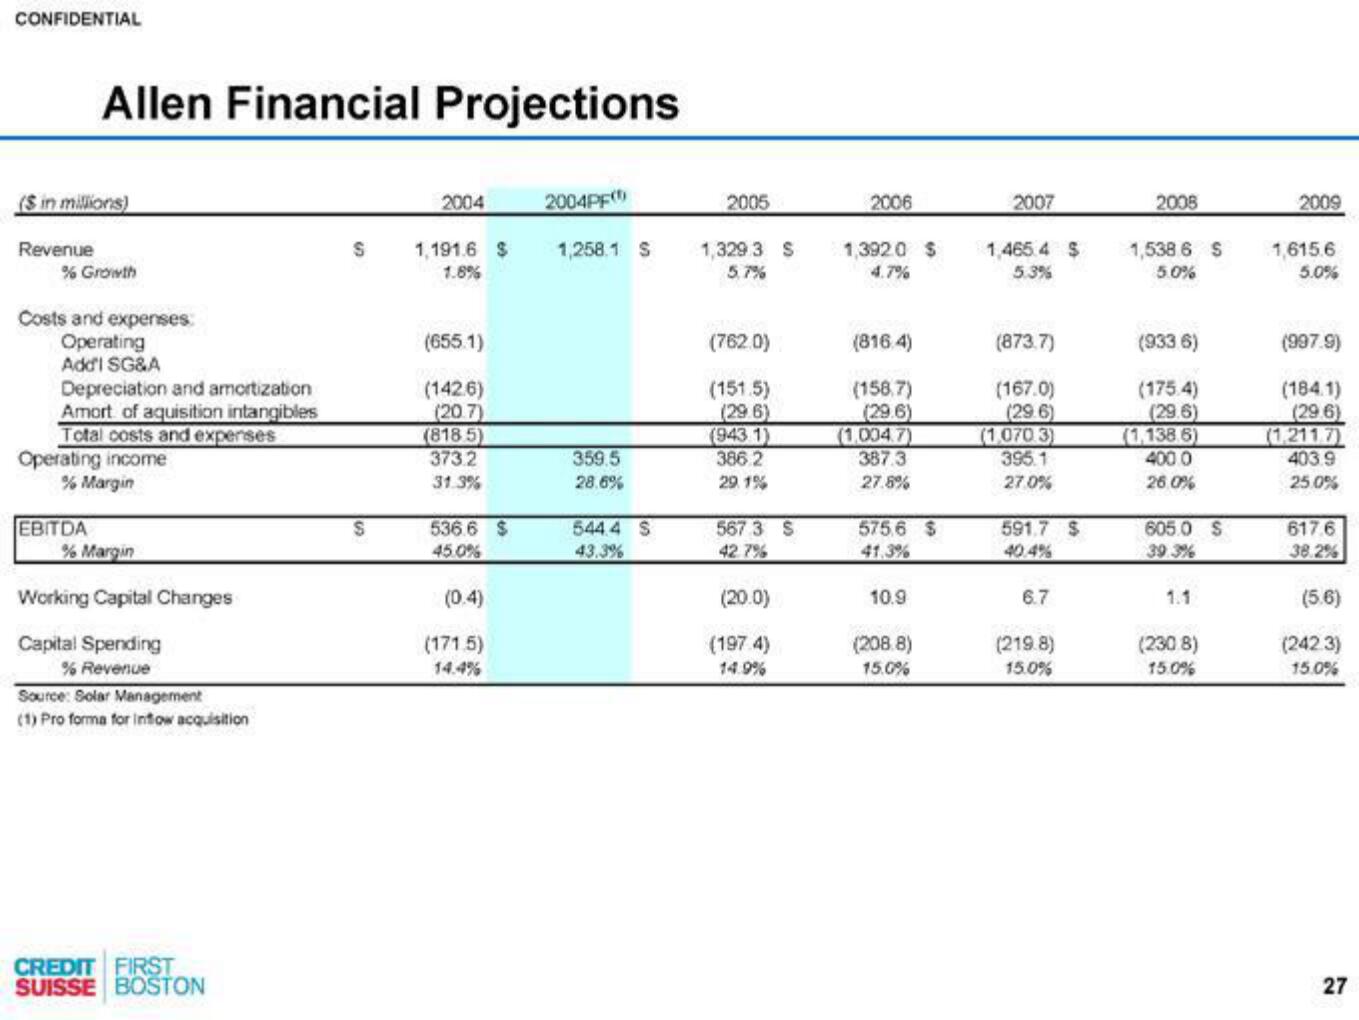
Allen Financial Projections
($ in millions)
Revenue
% Growth
Costs and expenses:
Operating
Add'l SG&A
Depreciation and amortization
Amort of aquisition intangibles
Total costs and expenses
Operating income
% Margin
EBITDA
% Margin
Working Capital Changes
Capital Spending
% Revenue
Source: Solar Management
(1) Pro forma for inflow acquisition
CREDIT FIRST
SUISSE BOSTON
2004
S 1,191.6 S
1.8%
S
(655.1)
(1426)
(20.7)
(818 5)
373.2
31.3%
536.6 $
45.0%
(0.4)
(171.5)
14.4%
2004PF
1,258.1 S
359.5
28.6%
544.4 S
43.3%
2005
1,329 3 S
5.7%
(762.0)
(151.5)
(29.6)
(943 1)
386.2
29.1%
567 3 S
42.7%
(20.0)
(197.4)
14.9%
2006
1,392.0 $
4.7%
(816.4)
(158.7)
(29.6)
(1.004.7)
387.3
27.8%
575.6 $
41.3%
10.9
(208.8)
15.0%
2007
1,465 4 S
5.3%
(873.7)
(167.0)
(29.6)
(1.070.3)
395.1
27.0%
591.7 $
40.4%
6.7
(219.8)
15.0%
2008
1,538 6 S
5.0%
(933 6)
(175.4)
(29.6)
(1,138.6)
400.0
26.0%
605.0 S
39.3%
1.1
(2308)
15.0%
2009
1,615.6
5.0%
(997.9)
(184.1)
(29.6)
(1.211.7)
403.9
25.0%
617.6
38.2%
(5.6)
(242.3)
15.0%
27View entire presentation