OpenText Investor Presentation Deck
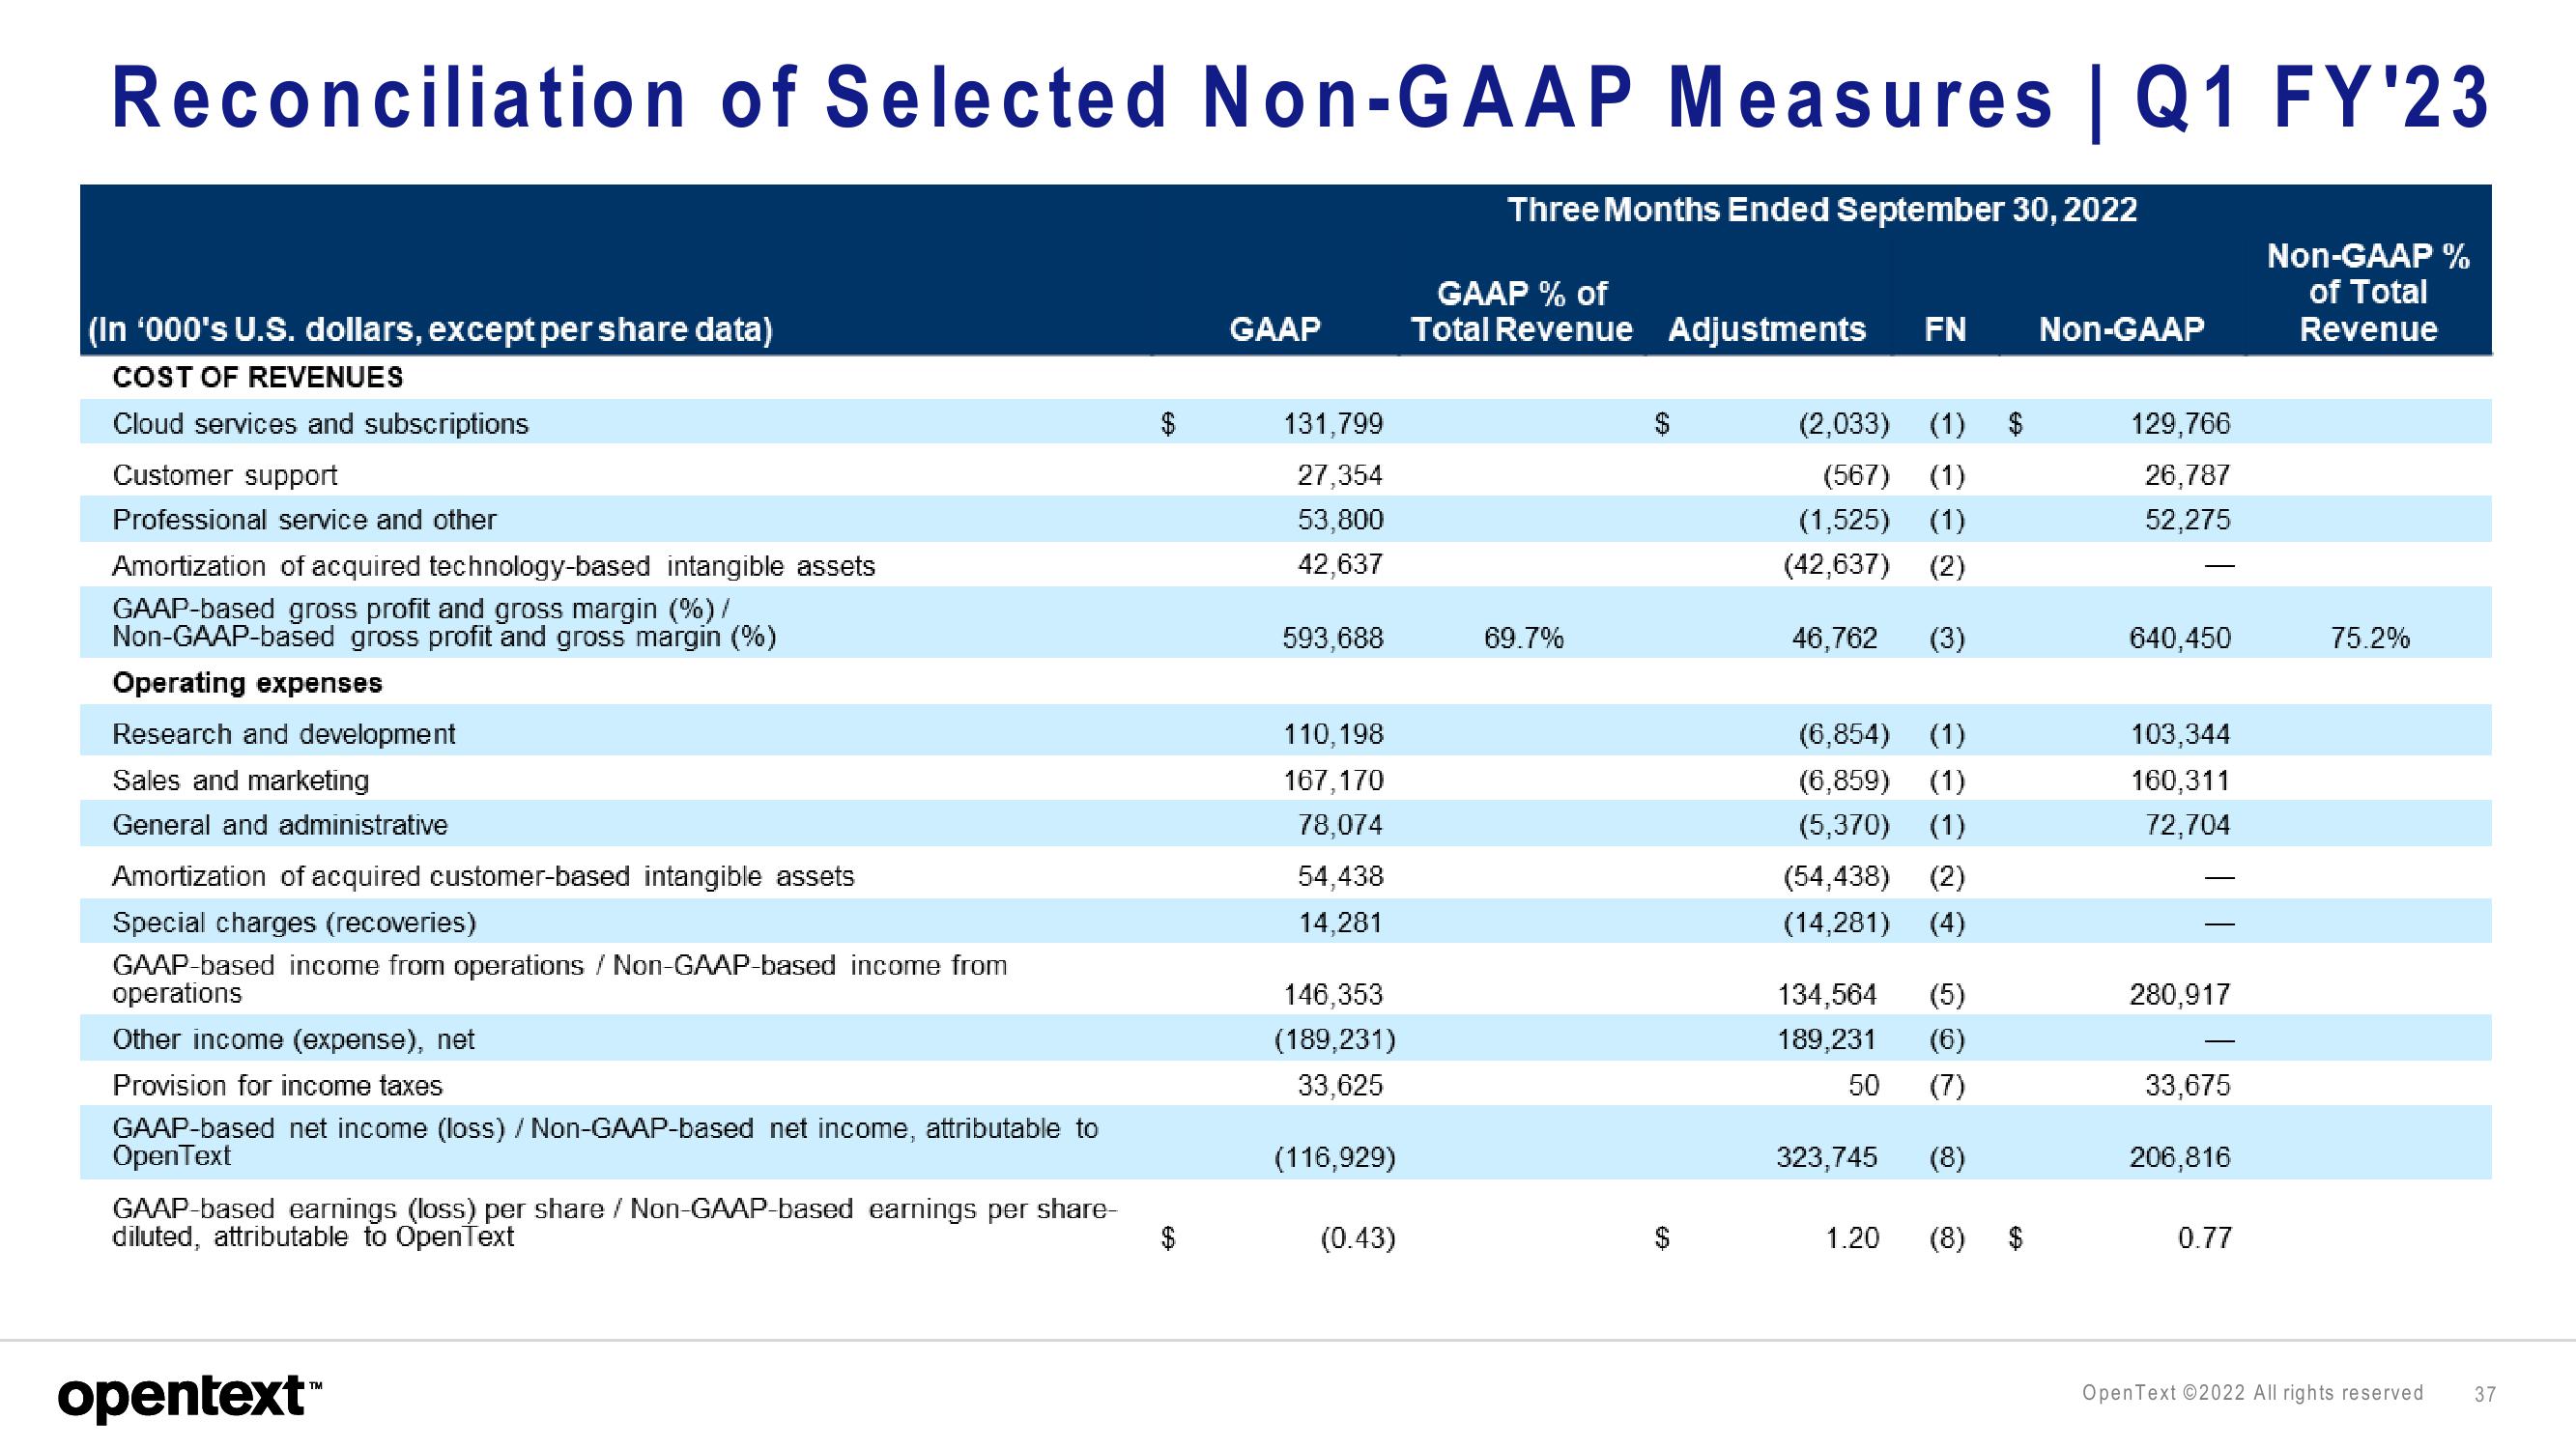
Reconciliation of Selected Non-GAAP Measures | Q1 FY'23
(In '000's U.S. dollars, except per share data)
COST OF REVENUES
Cloud services and subscriptions
Customer support
Professional service and other
Amortization of acquired technology-based intangible assets
GAAP-based gross profit and gross margin (%)/
Non-GAAP-based gross profit and gross margin (%)
Operating expenses
Research and development
Sales and marketing
General and administrative
Amortization of acquired customer-based intangible assets
Special charges (recoveries)
GAAP-based income from operations / Non-GAAP-based income from
operations
Other income (expense), net
Provision for income taxes
GAAP-based net income (loss) / Non-GAAP-based net income, attributable to
OpenText
GAAP-based earnings (loss) per share / Non-GAAP-based earnings per share-
diluted, attributable to OpenText
opentext™
$
GAAP
131,799
27,354
53,800
42,637
593,688
110,198
167,170
78,074
54,438
14,281
146,353
(189,231)
33,625
(116,929)
(0.43)
Three Months Ended September 30, 2022
GAAP % of
Total Revenue Adjustments FN Non-GAAP
69.7%
(2,033) (1) $
(567) (1)
(1,525) (1)
(42,637) (2)
46,762 (3)
(6,854) (1)
(6,859) (1)
(5,370) (1)
(54,438) (2)
(14,281) (4)
134,564 (5)
189,231 (6)
50
(7)
323,745 (8)
1.20 (8)
129,766
26,787
52,275
640,450
103,344
160,311
72,704
280,917
33,675
206,816
0.77
Non-GAAP %
of Total
Revenue
75.2%
OpenText ©2022 All rights reserved
37View entire presentation