Zegna SPAC Presentation Deck slide image

Zegna SPAC Presentation Deck

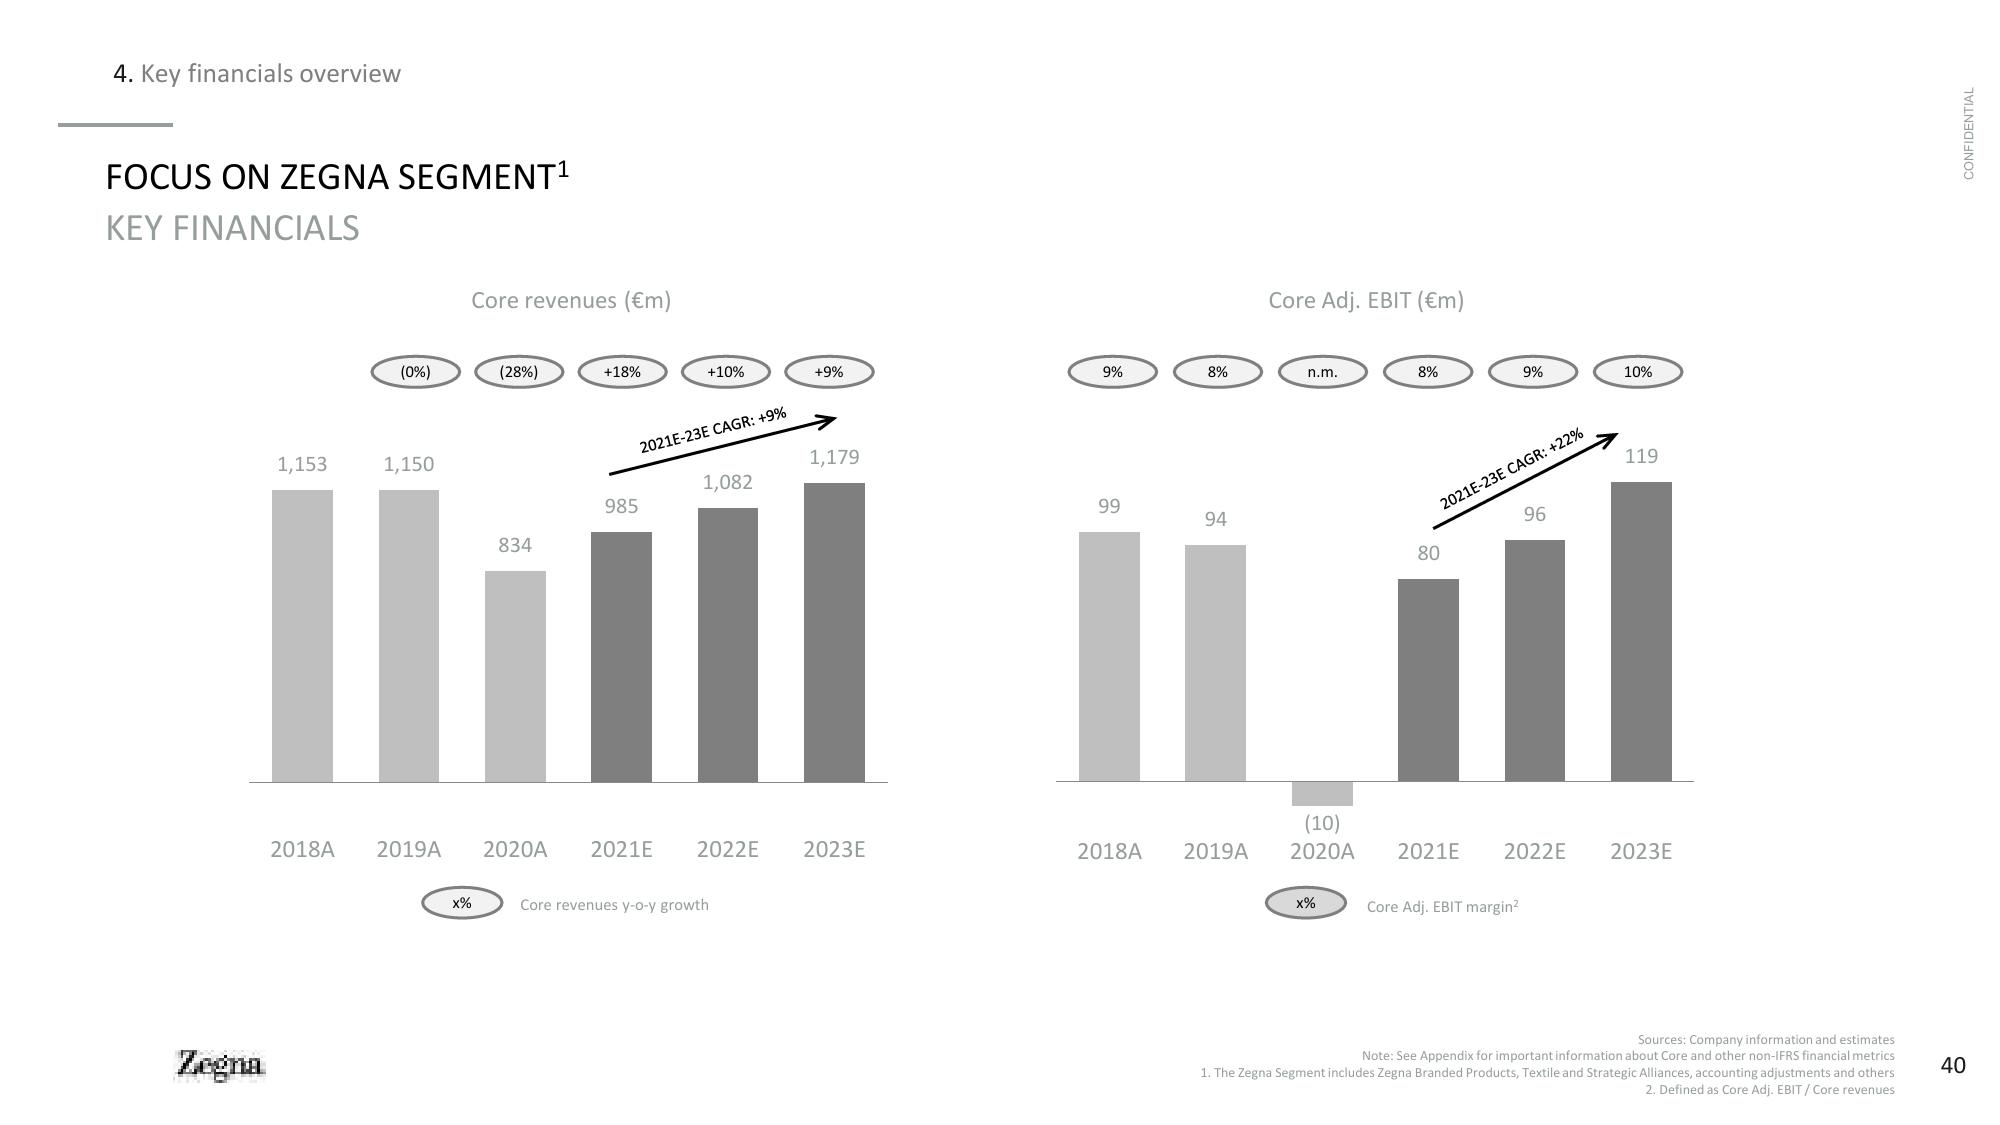
4. Key financials overview FOCUS ON ZEGNA SEGMENT¹ KEY FINANCIALS 1,153 Zegna (0%) 1,150 || 2018A 2019A x% Core revenues (€m) (28%) 834 +18% 985 +10% 2021E-23E CAGR: +9% 1,082 +9% Core revenues y-o-y growth 1,179 2020A 2021E 2022E 2023E 9% 99 8% 94 2018A 2019A Core Adj. EBIT (€m) n.m. (10) 2020A x% 8% 2021E-23E CAGR: +22% 80 9% Core Adj. EBIT margin² 96 2021E 2022E 10% 119 2023E Sources: Company information and estimates. Note: See Appendix for important information about Core and other non-IFRS financial metrics 1. The Zegna Segment includes Zegna Branded Products, Textile and Strategic Alliances, accounting adjustments and others 2. Defined as Core Adj. EBIT/ Core revenues CONFIDENTIAL 40
View entire presentation