Forward-Looking Statements Deck
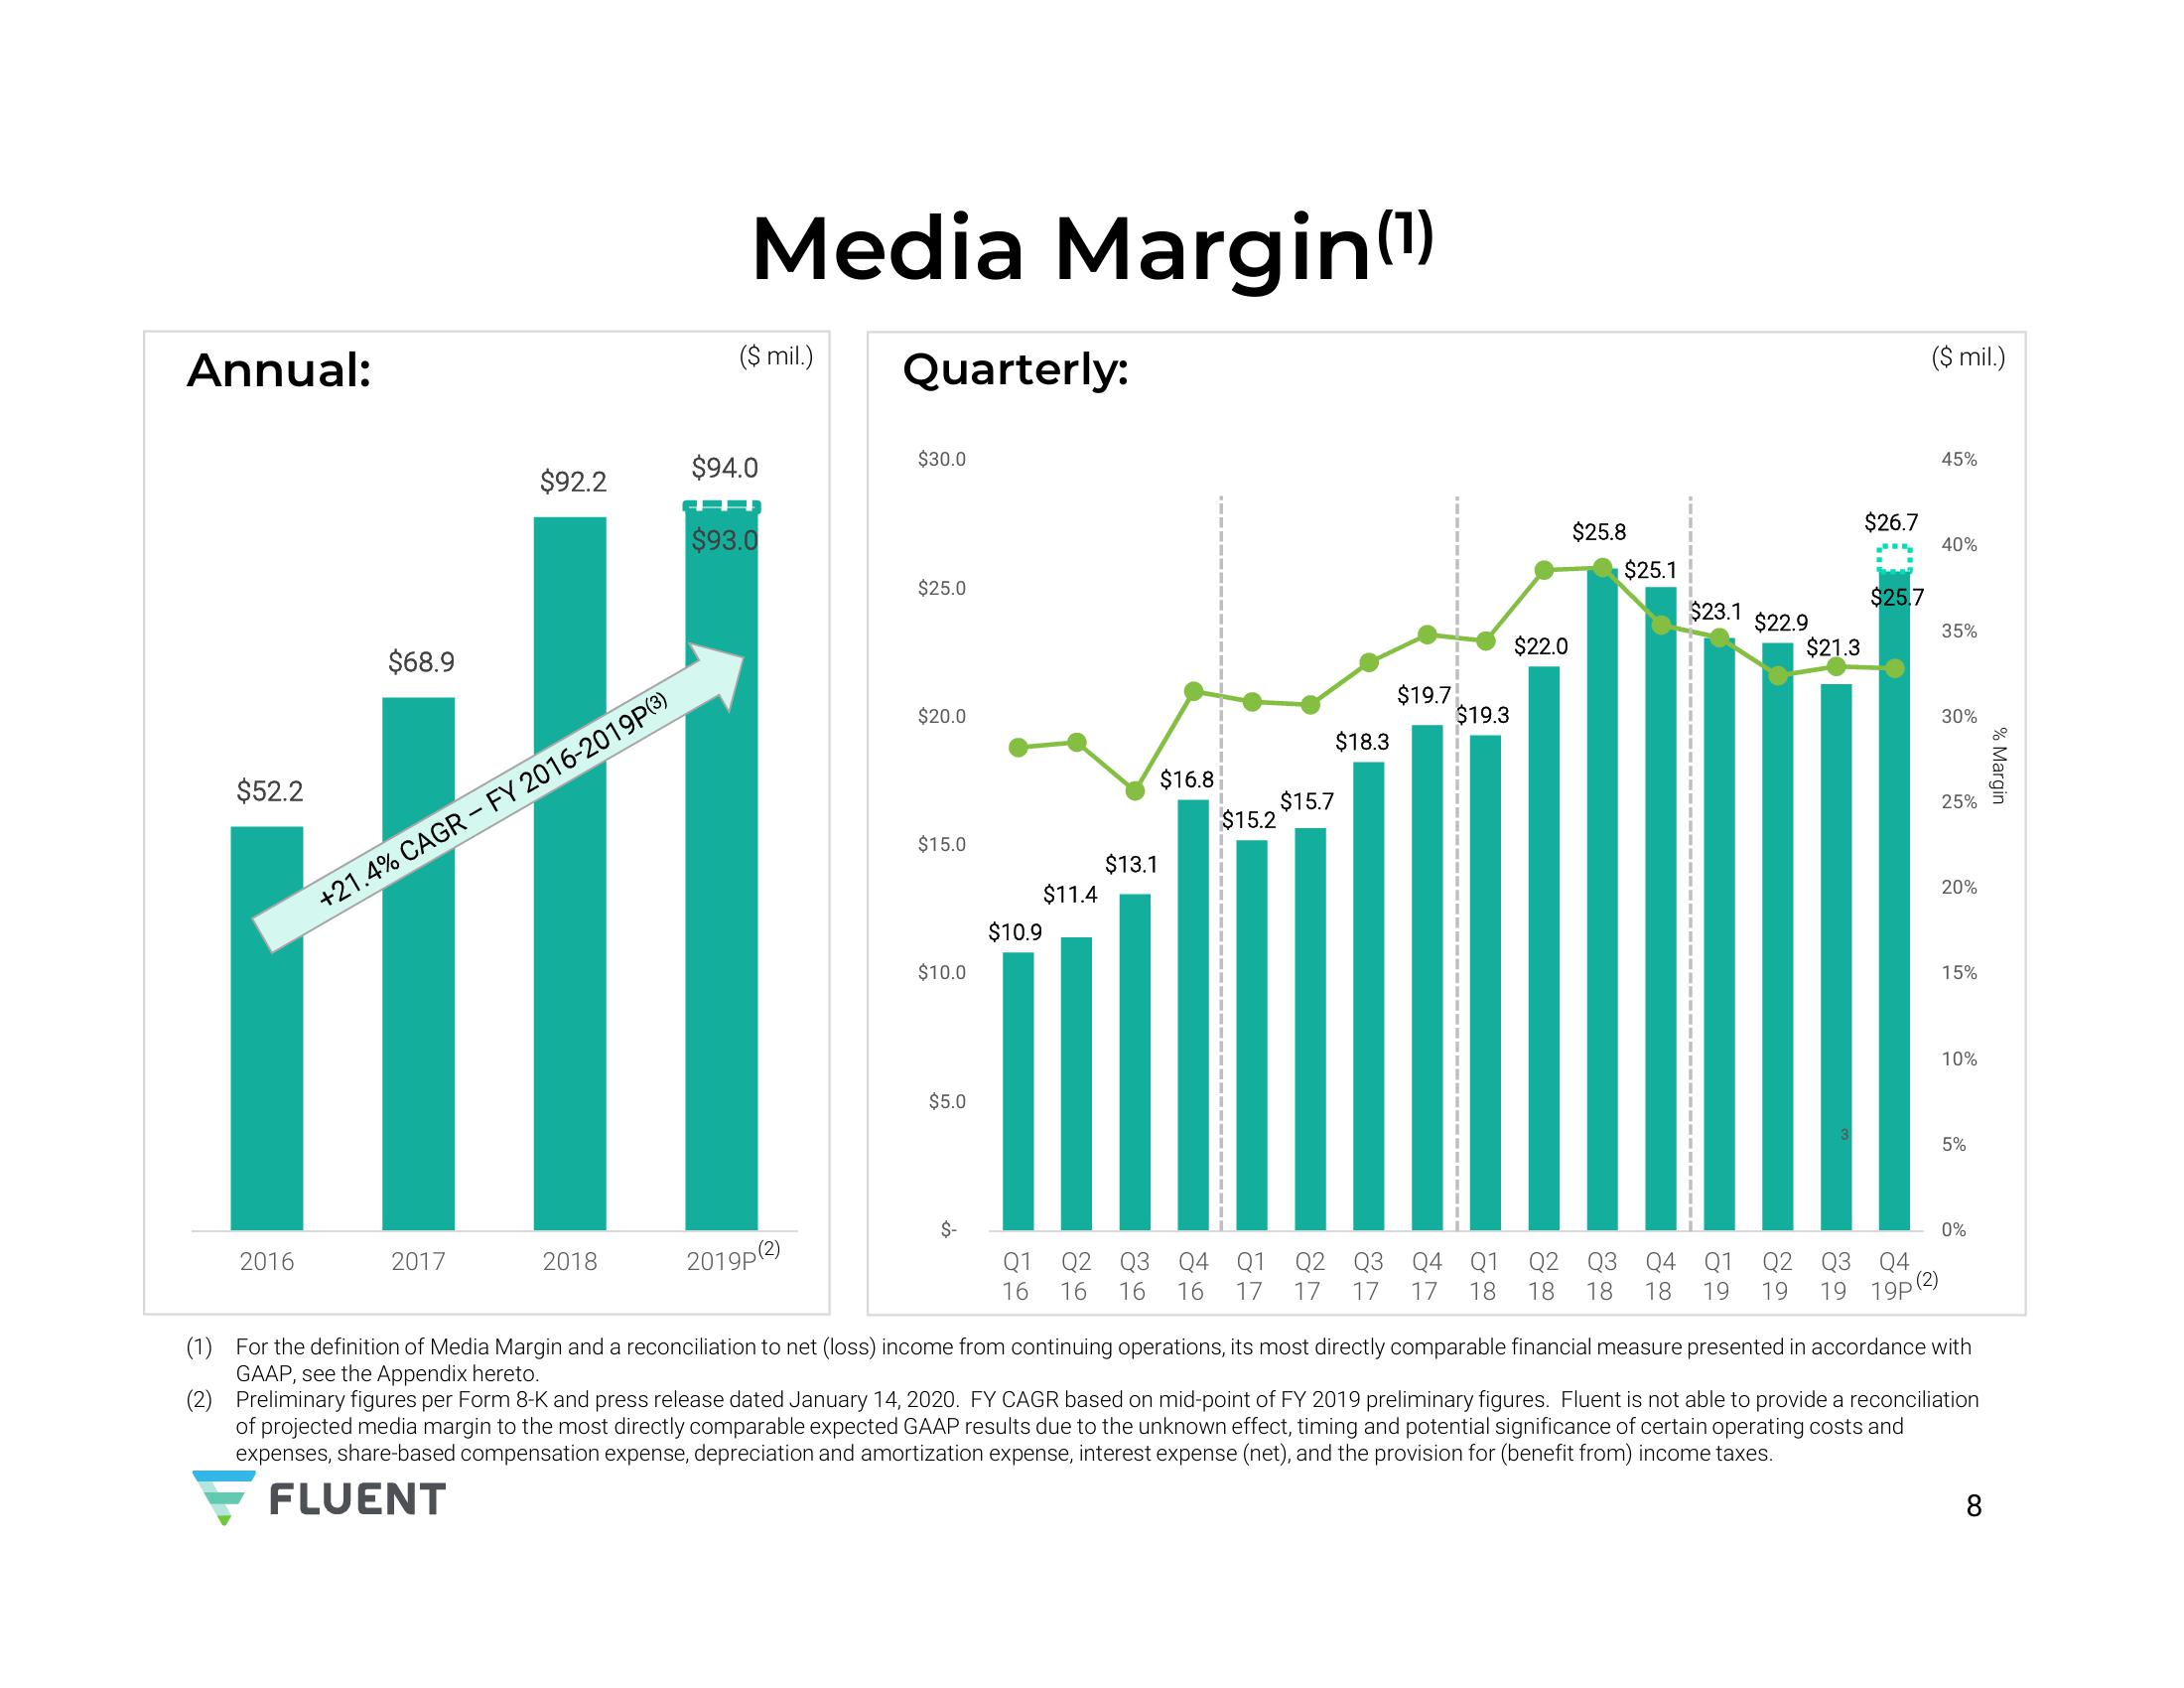
Annual:
$52.2
2016
$68.9
$92.2
2017
+21.4% CAGR - FY 2016-2019P(3)
2018
Media Margin(¹)
($ mil.)
$94.0
$93.0
2019p (2)
Quarterly:
$30.0
$25.0
$20.0
$15.0
$10.0
$5.0
$-
$10.9
$11.4
$13.1
$16.8
$15.2
$18.3
$15.7
$19.7
$19.3
$22.0
$25.8
$25.1
$23.1 $22.9
$21.3
$26.7
$25.7
($ mil.)
45%
40%
Q1
Q2 Q3 Q4 Q1
Q2
Q3 Q4 Q1
Q2 Q3 Q4 Q1 Q2 Q3 Q4
16 16 16 16 17 17 17 17 18 18 18 18 19 19 19 19p (2)
35%
30%
25%
20%
15%
10%
5%
0%
(1) For the definition of Media Margin and a reconciliation to net (loss) income from continuing operations, its most directly comparable financial measure presented in accordance with
GAAP, see the Appendix hereto.
(2) Preliminary figures per Form 8-K and press release dated January 14, 2020. FY CAGR based on mid-point of FY 2019 preliminary figures. Fluent is not able to provide a reconciliation
of projected media margin to the most directly comparable expected GAAP results due to the unknown effect, timing and potential significance of certain operating costs and
expenses, share-based compensation expense, depreciation and amortization expense, interest expense (net), and the provision for (benefit from) income taxes.
FLUENT
% MarginView entire presentation